Download
1 / 46
460 likes | 620 Views
Chapter 6 MONITORING CYCLES, JOBS, AND THE PRICE LEVEL. The business cycle Measures of labor market activity Unemployment Sources Duration Groups affected most Measuring the price level & inflation rate. Business cycle periodic but irregular up-and-down movement in production and jobs.

E N D
Chapter 6 MONITORING CYCLES, JOBS, AND THE PRICE LEVEL • The business cycle • Measures of labor market activity • Unemployment • Sources • Duration • Groups affected most • Measuring the price level & inflation rate.
Business cycle • periodic but irregular up-and-down movement in production and jobs. • NBER defines phases and turning points • Recession • significant decline in activity spread across the economy, • lasts more than a few months • visible in industrial production, employment, real income, and wholesale-retail trade. • begins just after the economy reaches a peak of activity • ends as the economy reaches its trough. • Expansion occurs between trough and peak • Bus. Cycle dates: http://www.nber.org/cycles.html/
Jobs and Wages • Current Population Survey • The U.S. Census Bureau conducts monthly surveys to determine the status of the labor force in the United States. • Approximately 60,000 households interviewed monthly. • Four months in, eight months out, four months in.
Jobs and Wages • To be considered unemployed, a person must be: • without work and have made specific efforts to find a job within the past four weeks, or • waiting to be called back to a job from which he or she was laid off, or • waiting to start a new job within 30 days.
Jobs and Wages • the population labor force categories and the magnitudes for 2006.
What was the unemployment rate in Dec 2008? (round your answer to nearest 10th and don’t use % sign -- e.g. 5.4) 20
What was the labor force participation rate in Dec 2008? (round your answer to nearest 10th and don’t use % sign -- e.g. 5.4) 20
What was the employment-population ratio participation rate in Dec 2008? (round your answer to nearest 10th and don’t use % sign -- e.g. 5.4) 20
The unemployment rate is pro-cyclical. • Yes • No 20
The employment-population ratio is pro-cyclical. • True • False 20
The labor force participation rate is pro-cyclical. • True • False 20
Cyclical behavior of employment statistics. • Are each of the following, pro- or counter-cyclical? • Unemployment rate • LFPR • Effect of discouraged workers • Employment-population ratio
Trends in employment statistics • The LFPR • increased from 59% in the 1960s to 67% in the 1990s. • for men has declined, but for women has increased. • fell for older workers since the 1950s, but has recently begun to rise. • The employment-population ratio • increased from 55% in the early 1960s to 67% in 2000. • declined for men and increased for women.
Jobs and Wages • Aggregate Hours • the total number of hours worked by all workers during a year. • increased since 1960 but less rapidly than the total number of workers because the average workweek has shortened.
Aggregate hours is proc-cylclical. • True • False 20
Jobs and Wages • Real Wage Rate • the quantity of goods and services that can be purchased with an hour’s work. • the money wage rate divided by the price level (more later) • Three measures • Hourly earnings in manufacturing • Total wages and salaries per hour • Total wages, salaries, & supplements per hour
Jobs and Wages • Real Wage Rate • compensation in 2000 dollars per hour of work.
Unemployment and Full Employment • Is duration of unemployment pro- or counter-cyclical? • As duration increases, is “pain” more or less concentrated?
Unemployment and Full Employment • Types of Unemployment • Frictional • Structural • Cyclical
Mary quit her job to move to another city. As she searches for a new job in her new location, she is • Frictionally unemployed • Structurally unemployed • Cyclically unemployed 20
Some believe that the U.S. automobile industry will forever be smaller. If John lost his job as an auto worker as a result of the down-sizing, John is: • Frictionally unemployed • Structurally unemployed • Cyclically unemployed 20
Some believe that the U.S. automobile industry will eventually return to its original size. If John lost his job as an auto worker as a result of the current recession, but expects that he will get his job back, John is: • Frictionally unemployed • Structurally unemployed • Cyclically unemployed 20
Unemployment and Full Employment • Full Employment • no cyclical unemployment • when all unemployment is frictional or structural. • Natural rate of unemployment. • unemployment rate at full employment • estimated to have been around 6 percent on average in U.S. • Higher in 1970s, lower in 1990s • Baby boom • Women • UI Generosity
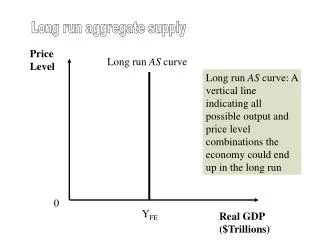
Unemployment and Full Employment • Potential GDP • Quantity of real GDP produced at full employment. • corresponds to the capacity of the economy to produce output on a sustained basis; • Actual GDP fluctuates around potential GDP with the business cycle. • Actual unemployment fluctuates around natural rate with the business cycle.
When the unemployment rate is above the natural rate, real GDP will be below potential GDP. • True • False 20
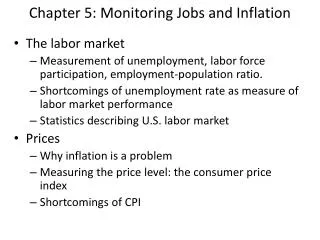
The Consumer Price Index • The price level is the “average” level of prices and is measured by using a price index. • CPI measures the average level of the prices of goods and services consumed by the average urban family. • The GDP deflator is another price index, reflecting the average price of all goods and services produced.
The Consumer Price Index • Constructing the CPI involves three stages: • Selecting the CPI basket • Conducting a monthly price survey • Using the prices and the basket to calculate the CPI
The Consumer Price Index • The CPI basket.
The Consumer Price Index • The CPI basket is based on a Consumer Expenditure Survey. • The current CPI based on a 1993-95 survey, although the reference base period is still 1982-84. • Every month, BLS employees check the prices of 80,000 goods and services in 30 metropolitan areas. • The CPI is calculated using the prices and the contents of the basket.
The Consumer Price Index If 1984 is base year, 1984 CPI ___________ 2005 CPI __________ If 2005 is base year, 1984 CPI ___________ 2005 CPI __________
Using 1984 base year, what is the CPI in 1984? (round answer to nearest 10th – e.g. 103.2) 20
Using 1984 base year, what is the CPI in 2005? (round answer to nearest 10th – e.g. 103.2) 20
Using 2005 base year, what is the CPI in 1984? (round answer to nearest 10th – e.g. 103.2) 20
Using 2005 base year, what is the CPI in 2005? (round answer to nearest 10th – e.g. 103.2) 20
The Consumer Price Index • The inflation rate • % change in price level between years. • = (CPI now – CPI last year) / CPI last year • = (CPI now / CPI last year) - 1 • Avg. annual inflation rate over past t years = (CPI now / CPI t years ago)1/t -1 • Avg. annual growth rate over past t years = (X now / X t years ago)1/t -1
Adjusting for changes in price level • In base year, how do nominal and real wages compare? • Suppose that between 2005 and 2006 nominal wages rise from $10 to $11 and the CPI rises from 140 to 150 • What was the inflation rate? • Growth in nominal wages? • Growth in real wages?
Inflation Questions • Using BLS data on average prices, answer the following • Inflation rate between 2004 and 2005. • Average annual rate of inflation between 1990 and 2005. • If a person earned $10 per hour in 1990, how much would they have to earn in 2005 to have the same real wage?
Suppose that between 2005 and 2006 nominal wages rise from $10 to $11 and the CPI rises from 140 to 150. What was the inflation rate? (nearest 10th, no % sign; e.g. 4.3). 20
Suppose that between 2005 and 2006 nominal wages rise from $10 to $11 and the CPI rises from 140 to 150. What was annual rate of growth in the nominal wage? (nearest 10th, no % sign; e.g. 4.3). 20
Suppose that between 2005 and 2006 nominal wages rise from $10 to $11 and the CPI rises from 140 to 150. What was the growth rate in the real wage? (nearest 10th, no % sign; e.g. 4.3). 20
The Bias in the CPI • A Congressional Advisory Commission estimated that the CPI overstates inflation by 1.1 percentage points a year. • Sources of bias: • New commodities • Quality improvements • Commodity substitution bias • Outlet substitution bias. • Why is the bias costly? • Government spending/taxes. • Social Security proposal • Private Contracts • Biases estimates of real earnings