Download
1 / 19
190 likes | 331 Views
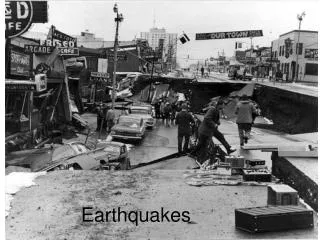
Earthquakes primarily occur along plate boundaries, with the deepest ones at subduction zones. An earthquake's focus is its origin point, while the epicenter is the surface location directly above it. Seismic waves, including P-waves, S-waves, and L-waves, transmit energy through the Earth. Seismographs record these waves and help determine the epicenter using lag time from multiple stations. The magnitude of an earthquake, measured by the Richter scale, indicates the energy released. Travel-time graphs further assist in locating epicenters based on distance.

E N D
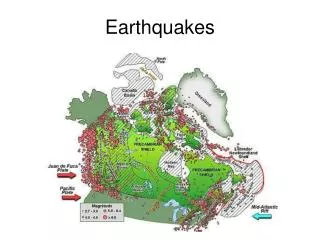
Most earthquakes occur at Plate Boundaries The deepest earthquakes occur at subduction boundaries
The focus of an earthquake is the source, or where it originates. The epicenter is the point on the Earth’s surface directly above the focus.
Types of Seismic Waves • P- Waves (elastic) – push and pull the ground • Travel through solids, liquids & gases • S-Waves (shear) – move the ground up and down. • Only travel through solids
Types of Seismic Waves • L-waves (rolling surface waves)- arrive last; move ground up and down and to the side • Only travel through solids
Recording Earthquakes • Seismographs record results on seismograms • The difference in arrival times of p and s waves= lag time • Using lag time we can find the distance to the epicenter
Recording Earthquakes The further away the seismograph station, the greater the lag time.
Recording Earthquakes • We need 3 seismograph stations to find the epicenter of an earthquake. • With one, it could be anywhere on the circle. • With two, it could be either two areas they touch. • With three, its where they all meet!
Why plate boundaries?? This is where the crust is under stress and potential energy is stored.
Magnitude Measure of how much energy is released. Richter scale is used to plot, from 1 – 10, how strong an earthquake is. Each increase in 1 equals 10 times more energy released.
Travel-Time Graphs • Used to record the distance (measured in km) from the recording center to the epicenter of an earthquake