
Analysis of Falls Efficacy in Amputees: Insights from Modified Falls Efficacy Scale
This study evaluates the falls efficacy of men with recent lower-limb amputations using the Modified Falls Efficacy Scale. The plotted group mean scores indicate that higher scores, situated closer to the plot's outer border, correlate with increased falls efficacy. Findings suggest significant temporal adaptations in quality of life and falls efficacy. The research contributes valuable data to rehabilitation practices, emphasizing the need for tailored interventions in this population. This study is published in the Journal of Rehabilitation Research and Development.

Analysis of Falls Efficacy in Amputees: Insights from Modified Falls Efficacy Scale
E N D
Presentation Transcript
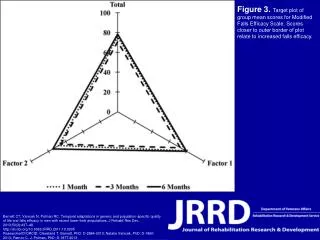
Figure 3. Target plot of group mean scores for Modified Falls Efficacy Scale. Scores closer to outer border of plot relate to increased falls efficacy. Barnett CT, Vanicek N, Polman RC. Temporal adaptations in generic and population-specific quality of life and falls efficacy in men with recent lower-limb amputations. J Rehabil Res Dev. 2013;50(3):437–48. http://dx.doi.org/10.1682/JRRD.2011.10.0205 ResearcherID/ORCID: Cleveland T. Barnett, PhD: D-2884-2013; Natalie Vanicek, PhD: D-1860-2013; Remco C. J. Polman, PhD: D-1877-2013