6-4 Normal Approximation to the Binomial Distribution
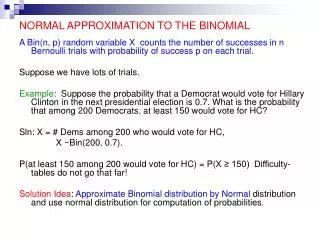
6-4 Normal Approximation to the Binomial Distribution. What if n is huge?. Obviously the calculator can help us deal with problems where n is large. Doing those problems by hand would be tedious and time consuming. But there is another solution…. And it is called The Normal Approximation.

6-4 Normal Approximation to the Binomial Distribution
E N D
Presentation Transcript
What if n is huge? Obviously the calculator can help us deal with problems where n is large. Doing those problems by hand would be tedious and time consuming. But there is another solution…. And it is called The Normal Approximation
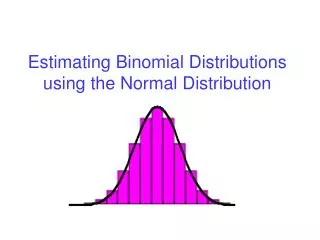
What is the Normal Approximation? If a binomial distribution fulfills certain criteria, then the binomial distribution will approximate a normal distribution. What were those rules? Chapter 5?
What is the Normal Approximation? If a binomial distribution fulfills certain criteria, then the binomial distribution will approximate a normal distribution. What were those rules? Chapter 5?
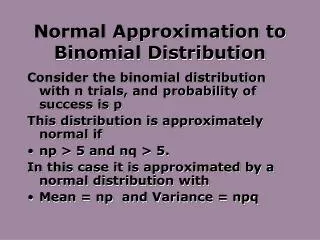
Normal Approximation If np > 5 and nq > 5, then r has a binomial distribution that is approimated by a normal distribution with
Normal Approximation If np > 5 and nq > 5, then r has a binomial distribution that is approximated by a normal distribution with As n increases the approximation gets better Page 337 in the book shows great pictures for this idea
What does this mean? Instead of calculating probabilities like the last chapter, this allows us to convert to z scores and compute the area under the curve. Quite simple if given a calculator. Not so bad if the table is used.
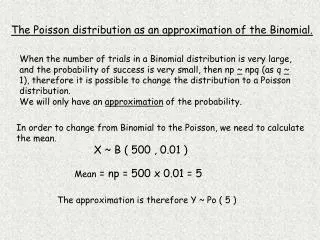
Application The owner of a new apartment building must install 25 water heaters. From past experience in other apartment buildings, the owner knows that Quick Hot is a good brand. A quick Hot heater is guaranteed for 5 years only, but the owner’s experience indicates that the probability that it will last 10 years is .25
1. What is the probability that 8 or more of the water heaters will last at least ten years? 2. How does this compare to the binomial formula?
Means and Variances Now that we have a good understanding of means and variances, lets review some topics. 1. If you add a constant to (or subtract a constant from) some data, the mean shifts but the variance (standard deviation) does not. Notation: E(X ± C) = E(X) ± C Var(X ± C) = Var(X) E(X) = μ
Means and Variances (cont) 2. If each value is multiplied by some constant, the resulting mean by the constant AND the standard deviation That is, E(aX) = aE(X) and Var(aX) = a2Var(X) SD(X) = aSD(X)
Means and Variances (cont) 3. If two random variables are independent, then the mean of the sum (difference) of the two variables is the sum (difference) of the mean 4. The variance of their sum or difference is always the sum of the variances. Note – this is NOT the sum of the standard deviations!!
Means and Variances (cont) This may seem kind of odd to add this topic here, but we have done enough work with random variables and means/standard deviations to see the relevence here.
Applicaiton You are planning to spend next year wandering through Kyrgyzstan. You plan to sell your used Isuzu Trooper to purchase an off-road Honda scooter when you arrive. Used Isuzus of the year and mileage of yours are selling for a mean of $6490 with a standard deviation of $250. Your research shows that scooters in Kyrgyzstan are going for about 65,000 soms with a standard deviation of 500 soms. You want to survive on your profite, so estimate what you can expect in your pocket after the sale and subsequent purchase. 1 US dollar = 43 Soms.
Lets try using the concepts here A = sale price of Isuzu (dollars) B = sale price of scooter (soms) D = profit (soms) D = 43A – B E(D) = E(43A – B) = 43E(A) – E(B) = 43(6940) – 65,000 = 233,420
Application Var(D) = Var(43A – B) = Var(43A) + Var(B) = 432Var(A) + Var(B) = 115,812,500 SD(D) = 10762 Soms. So, in dollars, this is about $5428 with a standard deviation of about $250. Can you survive??
1. What is the probability that 8 or more of the water heaters will last at least ten years? With her sample size and predicted p value, is it likely (detected by looking at the area under the curve) that at least 8 will last 10 years. Graph 2. How does this compare to the binomial formula? Last chapter – how did we figure out P(r ≥ 8)?
Another application For many years of observation, a biologist knows that the probability is only 0.65 that any given Arctic tern will survive the migration from its summer nesting area to its winter feeding grounds. A random sample of 500 Artic terns were banded at their summer nesting area. Use the normal approximation to the binomial and determine the probability that between 310 and 340 will survive.
Since n = 500, p = .65 then μ = σ = Continuity correction: Left EP = Right EP = Convert to z scores: Use your calculator 325 10.67 309.5 340.5 -1.45 ≤ z ≤ 1.45
Means and Variances Now that we have a good understanding of means and variances, lets review some topics. 1. If you add a constant to (or subtract a constant from) some data, the mean shifts but the variance (standard deviation) does not. Notation: E(X ± C) = E(X) ± C Var(X ± C) = Var(X) E(X) = μ
Means and Variances (cont) 2. If each value is multiplied by some constant, the resulting mean by the constant AND the standard deviation That is, E(aX) = aE(X) and Var(aX) = a2Var(X) SD(X) = aSD(X)
Means and Variances (cont) 3. If two random variables are independent, then the mean of the sum (difference) of the two variables is the sum (difference) of the mean 4. The variance of their sum or difference is always the sum of the variances. Note – this is NOT the sum of the standard deviations!!
Means and Variances (cont) This may seem kind of odd to add this topic here, but we have done enough work with random variables and means/standard deviations to see the relevence here.
Applicaiton You are planning to spend next year wandering through Kyrgyzstan. You plan to sell your used Isuzu Trooper to purchase an off-road Honda scooter when you arrive. Used Isuzus of the year and mileage of yours are selling for a mean of $6490 with a standard deviation of $250. Your research shows that scooters in Kyrgyzstan are going for about 65,000 soms with a standard deviation of 500 soms. You want to survive on your profit, so estimate what you can expect in your pocket after the sale and subsequent purchase. 1 US dollar = 43 Soms.
Lets try using the concepts here A = sale price of Isuzu (dollars) B = sale price of scooter (soms) D = profit (soms) D = 43A – B E(D) = E(43A – B) = 43E(A) – E(B) = 43(6940) – 65,000 = 233,420
Application Var(D) = Var(43A – B) = Var(43A) + Var(B) = 432Var(A) + Var(B) = 115,812,500 SD(D) = 10762 Soms. So, in dollars, this is about $5428 with a standard deviation of about $250. Can you survive??