Download
1 / 29
330 likes | 508 Views
A Turbidity Model For Ashokan Reservoir. Rakesh K. Gelda, Steven W. Effler Feng Peng, Emmet M. Owens Upstate Freshwater Institute, Syracuse, NY Donald C. Pierson New York City Department of Environmental Protection. 2009 Watershed Science & Technical Conference September 14 th -15 th ,

E N D
A Turbidity Model For Ashokan Reservoir Rakesh K. Gelda, Steven W. Effler Feng Peng, Emmet M. Owens Upstate Freshwater Institute, Syracuse, NY Donald C. Pierson New York City Department of Environmental Protection 2009 Watershed Science & Technical Conference September 14th-15th, Thayer Hotel, West Point, New York
network of 19 reservoirs • three controlled lakes • Croton, Catskill, Delaware systems • watershed: 1930 mi2 • storage: 550 BG • unfiltered supply • 1.2 BG/day • Ashokan Reservoir • watershed: 257 mi2 • storage: 130 BG • Catskill Aq.: 600 MGD • Turbidity < 8 NTU (90th percentile; 1987-2008) *
Ashokan Reservoir West Basin East Basin
West Basin Bridge and Dividing Weir Upper Gate Chamber East Basin
East Basin Diversion Wall
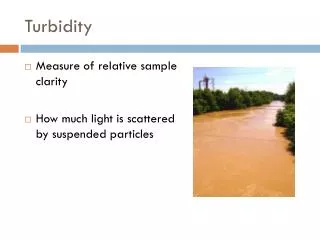
Turbidity Problem • stream channel and banks erosion – glacial and fluvial sediment; Esopus Creek 85% of the inflow • turbidity in waters leaving Ashokan Reservoir can be high following major runoff events • alum treatment before it enters Kensico – Nine alum events, 524 days during 1987-2007 • turbidity model to evaluate management alternatives
Features of Turbidity Model • Two-dimensional (longitudinal-vertical), laterally averaged transport framework (CE-QUAL-W2) • State variables: Temperature (T) and turbidity (Tn) • Three size classes of Tn • Source of Tn: external loading • Sinks: settling, export (via withdrawal, spill, waste channel diversion) • Two basins simulated separately
Model Grid – West Basin Esopus Creek 27 segments (~330 m avg) 47 layers (1 m) 1 branch dividing weir
Model Grid – East Basin dividing weir 37 segments (~ 300 m avg) 26 layers (1 m) 1 branch spill
Model Grid – Vertical Layers dividing weir west basin east basin
Turbidity (Tn) • primary metric of quality for water supplies • measure of light scattering by particles at 90° collection angle, units of NTU Tn α 90° 1 1 light scattering coefficient (b, m-1) incident beam 0° scattered light • Tn α b; supported in peer-reviewed literature • b, Tn = f (particle concentration, size distribution, composition, shape)
Scattering (b) and Turbidity (Tn): Behaves Like Intensive Properties • mass balance calculations can be done • well-established in optical literature (Davies-Colley et al. 1993) example Q1, b1, Tn1 Q, b, Tn Q=Q1 + Q2 Q2, b2, Tn2
Turbidity: As the Model State Variable • Tn is the regulated parameter • disadvantages of TSS (a gravimetric measurement) as an alternative (would have to rely on Tn = k · TSS) • differences in particle size and composition dependencies of Tn and TSS • Tn, b (scattering) and c (beam attenuation) measurements more precise • limitations in temporal and spatial resolution; e.g., robotic and rapid profiling capabilities for Tn and c • pore size for TSS measurements too large (1.7 µm) • variation in relationship between Tn and TSS in time and space (i.e., k is not really a constant) • Tn, [and c] supported in peer-reviewed literature, without published critical comments
Model Inputs Model testing period: 2003-2007 supported by UFI’s intensive (Robohut on Esopus Creek, in-reservoir robots) and DEP’s routine monitoring data constrained by the availability of operations data Additional (secondary) validation period: 1995-2002 Operations data Hydrologic inputs/outputs Loading of turbidity Creek temperature Meteorological data
In-Reservoir Robots: Example, 2007 April – November (June in 2007) depth-profiles every 6 hours depth interval 1 m
In-Reservoir Rapid ProfilingExample, 11/30/2006 after major runoff events depth interval 0.25 m
Example of Driving Conditions and Reservoir Response: June 2006
Turbidity-Causing Particles • Four Features: • number concentration • size distribution • composition • shape April 2005 Individual Particle Analysis (IPA) Technology • 75-80% clay • Tn associated with 1-10 µ • sub-µ particles unimportant • TSS filter pore size 1.7 µm; misses some turbidity causing particles bm(660) – minerogenic particle scattering coefficient, m-1
“Turbidity” Size-Classes for Model Esopus Creek Fractions in Esopus Creek Stokes Law: coefficient specification constrained by reality of particle characteristics as obtained from IPA
Hydrothermal Model Performance * withdrawal temperature (Tw) * importance of withdrawal depth information 2003-2007 1995-2002
Turbidity Model Performance * withdrawal turbidity (Tn,w) * importance of detailed monitoring of forcing conditions
Turbidity Model Performance East Basin 6/30/2006
Performance Summary Alum treatment events * * Normalized RMSE (Gelda and Effler, 2007) • performance for well monitored years consistent with that reported for Schoharie Reservoir (Gelda and Effler, 2007)
Summary • 2-D model CE-QUAL-W2 as transport framework • Turbidity as a state variable • Characterization of turbidity-causing particles • Three size classes • Model performed well in simulating in-reservoir and withdrawal temperature and turbidity • Model is suitable for evaluating management alternatives • Future research: resuspension, particle-based modeling including aggregation Gelda, R. K., S. W. Effler, F. Peng, E. M. Owens and D. C. Pierson, 2009. Turbidity model for Ashokan Reservoir, New York: Case Study. J. Environ. Eng. 135: 885-895. e-mail: RKGelda@UpstateFreshwater.Org
Ashokan Reservoir East Basin Spillway 4/2005