Download
1 / 15
150 likes | 289 Views
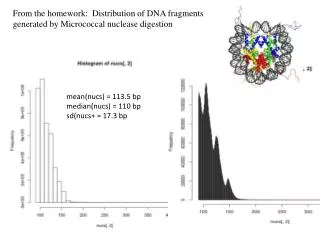
From the homework: Distribution of DNA fragments generated by Micrococcal nuclease digestion. mean( nucs ) = 113.5 bp median( nucs ) = 110 bp sd ( nucs + = 17.3 bp. http:// www.stat.wisc.edu /courses/language. Link to Jean-Yves Sgro’s R & Bioconductor Manual

E N D
From the homework: Distribution of DNA fragments generated by Micrococcal nuclease digestion mean(nucs) = 113.5 bp median(nucs) = 110 bp sd(nucs+ = 17.3 bp
http://www.stat.wisc.edu/courses/language Link to Jean-Yves Sgro’s R & Bioconductor Manual http://akka.genetics.wisc.edu/groups/genetics875/wiki/7a793/M_Oct_1_.html
R2 = 0.9897 R2 = 0.686 Why did the correlation go up? R2 = 0.804
Select differentially expressed genes to focus on Methods of gene selection: -- arbitrary fold-expression-change cutoff example: genes that change >3X in expression between samples -- statistically significant change in expression requires replicates Gene X expression under condition 1 Gene X expression under condition 2 Expression difference
Test if the means of 2 (or more) groups are the same or statistically different The ‘null hypothesis’ H0 says that the two groups are statistically the same -- you will either accept or reject the null hypothesis Choosing the right test: parametric test if your data are normally distributed with equal variance nonparametric test if neither of the above are true Why do the data need to be normally distributed?
Test if the means of 2 groups are the same or statistically different The ‘null hypothesis’ H0 says that the two groups are statistically the same -- you will either accept or reject the null hypothesis If your two samples are normally distributed with equal variance, use the t-test T = X1 – X2 difference in the means SED standard error of the difference in the means If T > Tc where Tc is the critical value for the degrees of freedom & confidence level, then reject H0 Notice that if the data aren’t normally distributed mean and standard deviation are not meaningful.
The paired t-test for gene expression ratios If your two samples are normally distributed with equal varianceAND your data were paired before collection, use the paired t-test Example: Tumor sample before and after treatment Gene expression differences expressed as ratios eg) mutant vs. wt log2 [ratio]: 5.0 4.3 6.7 T = D Average difference in expression SEM Standard error of the mean difference If T > Tc where Tc is the critical value for the degrees of freedom (n-1) & confidence level, then reject H0
Test if the means of 2 (or more) groups are the same or statistically different The ‘null hypothesis’ H0 says that the two groups are statistically the same -- you will either accept or reject the null hypothesis ANOVA (ANalysis Of Variance): for comparing 2 or more means variation between samples F = variation within samples If F > Fc where Fc is the critical value for the degrees of freedom (n-1) & confidence level, then reject H0 ANOVA only tells you that at least one of your samples is different … may need to identify which is different for >2 sample comparisons
Assessing & minimizing error in calls Type I error = false positives FDR = False Discovery Rate Type II error = false negatives Balance between minimizing false positives vs. false negatives Assessing false positives vs. false negatives: sensitivity vs. specificity Sensitivity (how well did you find what you want): # of true positives # of total significant calls ( = #true positives + # false negatives) Specificity(how well did you discriminate): # of true negatives # of total negative calls (= #true negatives + #false positives)
Assessing accuracy based on known truth: Receiver-Operator Curves (ROC) Known Truth is either a set of positive controls … or can come from simulated data Plot the fraction of True Positives (TPR) vs False Positives (FPR) called at each significance threshold
When working with many genes must correct for multiple testing … p < 0.01 means that there is a 1 in 100 chance that the observation is H0 But if you have 30,000 genes, with 0.01 change that each conclusion is wrong then you will get 300 false positives! Adjust the p-value cutoff such that there is a 1 in 100 chance of false identification for each gene: p = 0.01 / 30,000 ‘trials’p < 3 x 10⁻⁷ is significant (this is also known as Bonferroni correction)
Newer, better way of dealing with this is FDR correction FDR: false discovery rate How many of the called positives are false? 5% FDR means 5% of calls are false positive This is different from the false positive rate: The rate at which true negatives are called significant 5% false positives means 5% of true negatives are incorrectly called significant “The p-value cutoff [and false positive rate] says little about the content of the features actually called significant” (Storey and Tibshirani 2003) Storey and Tibshirani 2003: q-value to represent FDR
FDR = expected ratio of false positives vs all positives (Expected [F/S]) q value: for a given region of data space, what fraction of genes in that region are false? eg) Gene X has a q = 0.04 … this means that if you call Gene X significant, then all the genes with better statistics must also be called significant -> 4% of all of these genes are false positives “The q-value for a particular feature is the expected proportion of false positives incurred when calling that feature significant.”
FDR = expected ratio of false positives vs all positives: Expected [F/S] ~ Expected[F] / Expected [S] -- can initially estimate S based on a simple p-value cutoff We need to estimate 0 = m0 / m = fraction of all features that are truly negative Genes with p > 0.5 show a relatively flat density … because we expect that p-values of null genes are randomly distributed, we assume that most of these genes are true nulls … (The tuning parameter is the p cutoff above which nulls are assumed) in this case The density for genes with p>0.5 allows us to estimate the # of true negatives and thus 0