Download
1 / 65
660 likes | 817 Views
EAB & Other Invasive Forest Insects: 400 Years of Bad News. Deborah G. McCullough, Ph.D. Dept. of Entomology & Dept. of Forestry Michigan State University. Impacts of Exotic Forest Insects & Pathogens. Productivity & biodiversity Ecosystem functions Endangered species

E N D
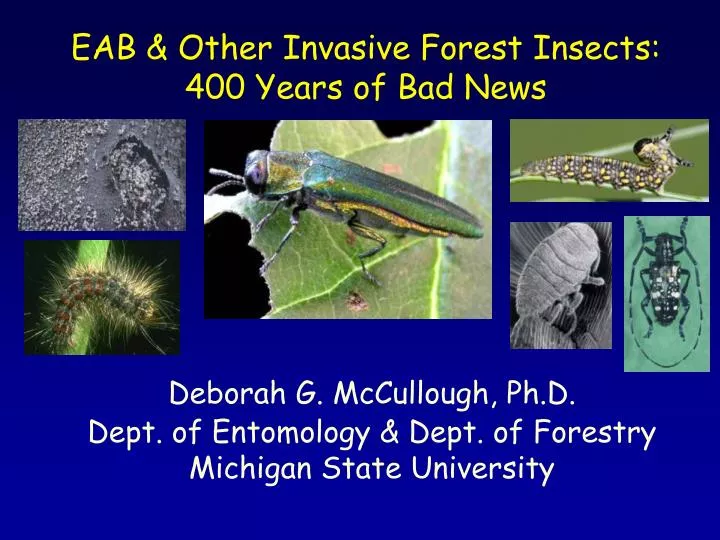
EAB & Other Invasive Forest Insects: 400 Years of Bad News Deborah G. McCullough, Ph.D. Dept. of Entomology & Dept. of Forestry Michigan State University
Impacts of Exotic Forest Insects & Pathogens • Productivity & biodiversity • Ecosystem functions • Endangered species • Quarantines & regulatory actions • Pesticide load • Diminished use of IPM or biocontrol
Easy to ignore invasive forest pests Unless YOUR tree is affected!
NCEAS Working Groups established in 2007 by The Nature Conservancy Working Group 1: Assess Economic Impacts of Invasive Forest Pests
Economic Impacts of Invasive Forest Pests Economics Jeff Englin (Univ Nevada) Robert Haight (USFS, MN) Tom Holmes (USFS, NC) Kent Kovacs (Univ Nevada) Insect Ecology Andrew Liebhold (USFS, WV) Deborah McCullough (MSU) Ecology Juliann Aukema (TNC, WA) Betsy von Holle (Univ Cent. FL) Brian Leung (McGill Univ) Amelia Nuding (NCEAS) Plant Pathology Kerry Britton (USFS, VA) Susan Frankel (USFS, CA)
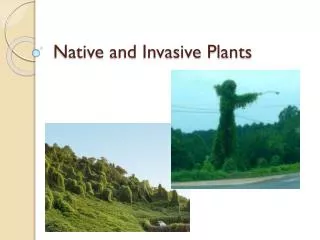
How many non-native forest insects are established in the US? What percent are invasive & cause damage? How frequently is a new non-native insect detected? Is the rate increasing? What kinds of non-native forest insects are here? (orders & families, feeding guilds) Where are those non-native insects established? Invasive Forest Insects in the US
Our Approach… • Long list: inventory of non-native forest insects established in U.S. • Short List = High Impact Pests: Insects & pathogens reported to cause economic damage in U.S. • For each pest, we recorded: • Order, Family, Primary host(s), Host range, • Feeding guild, Year detected (if known) • Distribution within US for High Impact pests
Long list: established forest insects in the U.S. 455 insect species: 8 orders & 64 families
High Impact list: damaging insect pests + 16 pathogens 62 insect species representing 6 orders, 26 families Represents 14% of Long List No. High Impact Insect Species by Order No. Insect Species
Roughly 2.5 non-native forest insects detected per year since 1860. Linear accumulation = steady rate. One High Impact Pest detected about every 2 years. All insects Y = 2.58(x) - 4802 R2 = 0.988 300 200 Cumulative Detections High Impact pests Y= 0.43(x) - 804 R2 = 0.977 100 1700 1800 1900 2000
Some Notable Pest & Pathogen Introductions Emerald ash borer Dogwood anthracnose Sirex wood wasp Dutch elm disease Asian longhorned beetle Alien Insect Detections Sudden oak death Balsam woolly adelgid Butternut canker Hemlock woolly adelgid Pre 1900: gypsy moth, beech scale, Chestnut blight, WPBR
No. insects by feeding guild – Long List Long List ( 455 sp) Sap feeders = 42% Foliage feeders = 33% Borers = 16% Other = 8% High Impact List (62 sp) Sap feeders = 34% Foliage feeders =42% Borers = 24% No. High Impact insects by feeding guild
Foliage feeders: Declining since 1920s; Maybe 1912 Plant Pest Act? Sap feeders: similar decline but still steady; Maybe nursery plants? Borers: sharp increase since 1980s. Maybe SWPM? No. of detections by feeding guild
How are invasive forest pests distributed across the U.S.? Short list:High Impact Forest Pests 62 insect species + 16 pathogens 1. Distribution data acquired for each pest species 2. Primary host(s) distributions, volume & basal area acquired from FIA database 3. Current distribution of alien forest pests & their potential hosts mapped; maps available on internet on Alien Forest Pest Explorer web site (created by Liebhold et al.)
Beech distribution Beech Bark Disease Alien Forest Pest Explorer: distribution map for each High Impact pest & its hosts
What explains the spatial distribution of invasive forest pests in the U.S? European colonization? Immigration? Historical trade? Commodities imported? Forest species diversity? Cargo arrival, shipping? Something to ponder…!
Our Approach… • Long list: Non-native, established forest insects • High Impact list: Insects & pathogens reported to cause economic damage • Poster Pests: a “big name” pest per feeding guild. In-depth assessment of direct economic impacts & potential effects on ecosystem services. • EAB (borers) Gypsy moth (defoliators) Hemlock woolly adelgid (sap feeders) Sudden oak death (pathogens)
Economic Impacts of EAB Kovacs, Haight, McCullough, Mercader, Siegert, Liebhold. 2009. Ecological Economics. In press. Estimated discounted costs of insecticide treatment or removal & replacement of ash trees on developed land through 2020. 25-state study area centered on Detroit = EAB origin
Predicting EAB Spread If current situation of “no-action” at outlier sites continues, where will EAB be established in 2020? Stochastic simulation model can be used to predict EAB distribution over time, using what we know about current EAB infestations.
2008 Predicting EAB Spread • Started with counties infested December 31, 2008
Simulating EAB Spread • Used initial EAB infestation in Detroit in 1994 (based on Siegert et al. dendrochronlogy data) • Overlaid grid of 5000 points (25 km2) centered on Detroit & extending 750 miles in all directions. • Plotted the distance of infested points in December 2008 to Detroit. • Used Negative Exponential Function to describe relation between infested points & distance to Detroit. • Ran 500 simulations over 14 year period to identify model with the best fit to 2008 EAB distribution.
Stochastic Simulation Model: What is the likelihood that any one point will become infested? 750 miles county & state boundaries
Steps in the Stochastic Simulation Model 1) Probability point j will infest point I a = 0.94, b = 0.06, D = distance i to j (km) 2) Probability used in random number generator based on binomial distribution to determine if infestation realized. 3) If infestation realized from any point j to i, then i was considered to be infested. Distance between Points i &j in km. 0.06
Model fit to distribution of infested counties (2008) = Observed = Mean Predicted r2 = 0.979 • Selected the best function & ran it 500 times for the period 2009 to 2020. • Determined probability of any given point in the grid becoming infested each year.
EAB Forecast Simulation Results 2008 2010
EAB from Canada EAB Forecast Simulation Results 2008 2010 2012
EAB Forecast Simulation Results 2008 2010 2012 2014
EAB Forecast Simulation Results 2008 2010 2012 2014 2016
EAB Forecast Simulation Results 2008 2010 2012 2014 2016 2018
EAB Forecast Simulation Results 2008 2010 2012 2014 2016 2018 2020
Simulation Results – Predicted EAB Expansion 2008 2020 • Model results are quite conservative • Spread constrained by 750 mile radius from Detroit • No long-distance outliers included • 2009 outliers would increase rate of spread
Economic Impacts of EAB - Results An estimated 38 million ash trees occur on the urban land base in the 25 state area. EAB infestation likely to encompass at least 17 million landscape ash trees that will require treatment or removal & replacement. Average discounted cost = $10.7 billion over 10 years. Including developed suburban land nearly doubles the number of affected ash trees & the associated cost. Kovacs et al. 2009. Ecological Economics EAB costs appear much higher than other Poster Pests.
Is there anything we can do? 2009 2020
EAB Efforts to date… • Detection surveys • Regulation of ash trees, logs, wood • Eradication attempts • Outliers are generally left untreated, effectively a “do-nothing” approach. • Expensive • Unpopular • Poor rate of success
Fraxinus sp. • EAB has killed nearly 100% of ash trees in forested sites in SE MI (OSU data - Smith, Ghandi, Herms) • Ash mortality not related to stand, site or tree traits (no effective silvicultural solutions) • Potentially 15 native ash species in U.S. at risk A “do-nothing” approach to EAB likely means the demise of the North American ash resource.
EAB management must evolve… • Can we integrate the available tools & strategies to slow EAB population growth & expansion in outlier sites? • Delay the onset & advance of ash mortality • Slow overall spread of EAB in North America • Buy time for planning & research
SLAM: An Integrated Approach to SL.owing A.sh M.ortality Caused by Emerald Ash Borer
What tools are available for SLAM? • Girdled ash trees: highly attractive to adult EAB • Track low density EAB populations; • Provide distribution, density & development data. • Reduce phloem - fewer EAB produced.
Influence EAB spread Jasper 1 Girdled Trees in Low Density EAB Populations Function as “sinks” to reduce population growth
What tools are available for SLAM? • Girdled ash trees – debarked or destroyed • Insecticides • Protect landscape trees • Reduce EAB density • Integrate into SLAM?
Systemic Insecticides for EAB Control: 2-Year Evaluation D.G. McCullough1, T.M. Poland2, A. Anulewicz1, D. Cappaert1, P. Lewis3, J. Molongoski3 MSU1, USFS2, APHIS3 Imicide injection Tree-age injection Safari trunk spray
Systemic Insecticides: 2-Year Evaluation 7 trees/block; 25 blocks; 3 sites; DBH 6” to 21” All trees treated May 2007; Half the trees treated again in May 2008; the other trees were not re-treated in 2008. Emamectin benzoate (Tree-äge) Trunk injection Dinotefuran (Safari 20WP) Trunk spray (with & without Pentra-Bark) Imidacloprid (Macho 2F) Trunk spray (with & without Pentra-Bark) Imidacloprid (Imicide 10%) Trunk injection Controls No treatment
Larval density: Trees treated only in 2007 Trees treated in 2007 & 2008 Larval density: Trees treated 2007 & 2008 120 a 100 ab 80 EAB larvae per m2 abc 60 abc bc bc 40 c 20 0 Ctrl Dino Dino-PB Em Ben Imid Imid-PB Maug-imi Fall 2008: Trees felled & debarked to count EAB larvae Neo-nicotinoid products were fairly effective if applied annually. Emamectin benzoate (Tree-age) ≈ 100% EAB control for at least 2 years with a single injection.
Larval density: Trees treated only in 2007 • A single Tree-age injection provided at least 2 years control of EAB adults & larvae. • Special registration for Tree-age in 10+ states; full registration requested from EPA. • Changes the economics of treating ash trees.
What tools are available for SLAM? • Girdled ash trees – debarked or destroyed • Insecticides • Ash utilization (timber sales, firewood harvest) • Reduce phloem – fewer EAB produced • Value for landowners