Download
1 / 73
740 likes | 903 Views
CI Norwood. Weather Maps and Services. Meteorology 3. Ref: FTGU Pages 158-172, AIM MET Section. Review. What are the four air masses that affect Canada ? What is a Front ? What does a thunderstorm need in order to form?. Topics to be covered. Weather services and maps How to read:

E N D
CI Norwood Weather Maps and Services Meteorology 3 Ref: FTGU Pages 158-172, AIM MET Section
Review • What are the four air masses that affect Canada? • What is a Front? • What does a thunderstorm need in order to form?
Topics to be covered • Weather services and maps • How to read: • Surface/Upper level/Prog charts • METARs/TAFs • GFAs/FDs • Need to know this as interpretation of weather is crucial to aircraft safety.
Aviation Weather Information Service (AWIS) • NavCanada FSS system • Provides weather information to help pilots before and during flight • Service puts pilots in contact with specialists who help pilots make educated decisions and calculations based on factors relating to weather conditions
Aviation Weather Briefing Service (AWBS) • Fully interpretive weather briefing service available from the Flight Information Centers (FIC) • Access through toll free number • Equipped with complete set of weather products, including satellite and radar imagery • Specialists trained to interpret the weather data for the needs of users in aviation industry, as well as offer advice on particular weather situations • Documents for long distance flight available on request
Flight Service Stations (FSS) • Staffed by flight information specialists • Situated at various aerodromes across Canada • Services offered: • Enroute Flight Information Service (FISE) • Flight Planning Service • Surface weather observation service • Aviation Weather Information Service (AWIS) • Aviation Weather Briefing Service (AWBS) • VFR Alerting Service • NOTAM service • PIREPs
Pilot’s Automatic Telephone Weather Answering Service (PATWAS) • Continuous recording of certain local weather information intended for aviation is issued by some FSS and is available by telephone • Include: • Issuing station name and introduction, Instructions • SIGMETs, AIRMETs, METAR and SPECI • TAF and FDs • Freezing level, icing and turbulence • PIREPs • Times of sun-rise and sun-set
Significant Meteorological Advisories (SIGMET) • Short term alerts to aircraft in flight concerning potentially hazardous weather conditions • Issued for the following phenomenon: • Active thunderstorm cells • Squall lines • Severe hail • Severe turbulence • Severe icing • Significant mountain wave effects • Hurricanes • Far-reaching sand or dust storms • Volcanic ash • Low-level wind shear
Automated Terminal Information Service (ATIS) • Continuous broadcast of recorded non-control information at busier airports • Essential information: • Weather information • Active runways • Available IFR approach • NOTAMs, etc. • Pilots listen to ATIS prior to contacting control unit • Reduce controller’s workload and relieve frequency congestion • Updated every hour or when necessary • Comes with a letter designator to ensure most current version is in use
High Altitude SIGWX Charts • Shows SIGWX for a specific flight range: • Icing, turbulence and convective activity • Flight between FL250-FL630 (380-75 hPa) • Valid at 0000, 0600, 1200, 1800 UTC • Issued by the National Weather Service of the United States government; the equivalent of the Canadian Weather Service
Mid-level SIGWX Charts • Shows SIGWX for a specific flight range: • Icing, turbulence and convective activity • Flight between FL100 – FL240 (700-400 hPa) • Valid at 0000, 0600, 1200, 1800 UTC • Issued by the Canadian meteorological centre of Environment Canada • Based on information collected from all the aviation weather forecast centers of the country
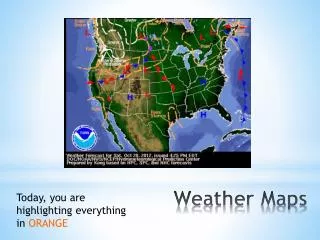
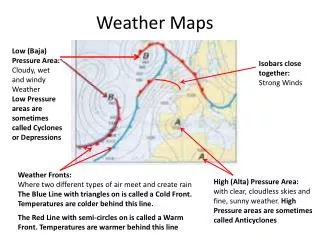
Surface Weather Charts • Graphical depiction of: • MSL pressure patterns • Surface location of fronts • Surface precipitation and obscurations to vision • Pressure patterns can be considered accurate up to 3,000 feet • Observed every six hours, issued 2 to 3 hours after observation
Upper Level Analysis Charts • Computer generated graphical depiction of reported atmospheric conditions at the pressure level, which include: • Wind speed and direction • Temperature • Moisture content • Frontal surface locations • Measured twice a day, at 0000Z and 1200Z • Issued for 850 mb (5,000’), 700 mb (10,000’), 500 mb (18,000’) and 250 mb (34,000’)
Upper Level Analysis Charts • Height: Contours represent the height of the pressure level in decameters, spaced 60 m apart on except on 250 mb charts where it’s spaced 120 m • Temperature: Analysed on 850 and 700 mb, drawn as dashed lines at 5 degree intervals. Can be read in the top corner of station plots at higher altitudes • Wind speed and direction: Can be determined by direction and spacing of contours, or by isotachs on the 250 mb chart, given in 30 ktintervals
Upper Level Wind Chart • Provides the forecast of temperature and winds for a given flight level • Three distinct geographic regions: • EAST, NORTH and WEST • Essentially the same as the FDs except only one flight level can be seen due to graphically depicted form • Computer generated • Wind direction in relation to True North • Valid at 00, 06, 12, 18 UTC • National Weather Service (US government)
Surface Prognostic Charts • Graphical forecast of weather at the surface • For the purposes of aviation, Canada does not issue surface prognostic charts, American ones can be used • Issued for latest surface analysis, 12-, 24-, 36- and 48-hour forecast times • Shows pressure systems and patterns, front positions, precipitation and ground obscurations
METARs • Aviation Routine Weather Report • Observation of the actual weather from the ground • Issued on the hour and valid only for the time taken • A SPECI is a special weather report that when a significant change in the weather has occurred • Each METAR and SPECI is composed of several standard groups • METAR CYKZ 202000Z 33009KT 15SM FEW020 BKN091 M01/M06 A2993 RMK SC2AC3 SLP144=
Format of METAR • Report type: METAR or SPECI • Location type: CYYZ (Toronto) • Date/Time: 231700Z -> 23rd day at 1700 Zulu • Report modifier: AUTO or CCA, CCB • Wind: 00000KT -> Calm 35009KT -> 350°T @ 9 kts VRB03KT -> Variable @ 3 kts 30015G25KT -> 300°T @ 15 gusting 25 kts 30015G25KT 260V340 -> 300°T @ 15 gusting 25 kts, wind is varying from 260 true to 340 true • Visibility: 5/8 SM, 1 ½ SM, P6SM, 15 SM • RVR: R33/4000FT/U -> Rwy 33, 4000’ increasing R24L/1000V1200FT/D -> ?
Present Weather Codes Intensity or Proximity Descriptor • Precipitation intensity refers to all forms at the time combined • - ->Light (-RA = Light rain) • Moderate (no qualifier) • + Heavy (+SN = Heavy snow) • VC = In the vicinity (within 5SM) • MI = Shallow • BC = Patches • PR = Partial • DR = Drifting • BL = Blowing • SH = Showers • TS = Thunderstorms • FZ = Freezing
Present Weather Codes Precipitation Obscuration • DZ = Drizzle • RA = Rain • SN = Snow • SG = Snow grains • IC = Ice crystals (Vis ≤ 6 SM) • PL = Ice pellets • GR = Hail • GS = Snow pellets • UP = Unknown precipitation • BR = Mist (Vis ≥ 5/8 SM) • FG = Fog (Vis < 5/8 SM) • FU = Smoke (Vis ≤ 6 SM) • DU = Dust (Vis ≤ 6 SM) • SA = Sand (Vis ≤ 6 SM) • HZ = Haze (Vis ≤ 6 SM) • VA = Volcanic ash (Any vis)
Present Weather Codes Other • PO = Dust/sand whirls (dust devils) • SQ = Squalls • +FC = Tornado or waterspout • FC = Funnel cloud • SS = Sandstorm • DS = Duststorm
Sky Condition • SKC - “sky clear” - no cloud present • FEW - “few” - >0 to 2/8 oktas • SCT - “scattered” - 3/8 to 4/8 oktas • BKN - “broken” - 5/8 to <8/8 oktas • OVC - “overcast” - 8/8 oktas • CLR - “clear” - clear below 10,000’ as interpreted by an autostation • Significant convective cloud (CB or TCU) are identified with the sky condition groupSCT025TCU – Scattered TCUs at 2500’ • A ceiling is said to exist at the lowest BKN or OVC layer • All cloud heights are in AGL
Temperature/Dewpoint: 10/05 – Temp: 10°C, Dewpoint: 05°C 05/M01 – Temp: 05°C, Dewpoint: -1°C • Altimeter setting: A2992 – 29.92” Hg A3031 – 30.31” Hg • Recent weather: Significant weather • Wind shear: Low level windshear within 1600’ AGL along t/o or landing path or a specific runway “WS R33L”
Remarks • Include: • Cloud layer type and opacity in oktas (SF5) • General weather remarks • Sea level pressure: SLP134 = 1013.4 hPa • SPECI CYEL 201958Z 36010KT 1SM -SHSN OVC008 RMK SF8 WNDS ESTD= • METAR CYEL 201900Z 36010KT 15SM -SHSN BKN030 BKN080 M05/M10 A3003 RMK SC6AC2 WNDS ESTD SLP190=
Aerodrome Forecast (TAF) • Description of the most probable weather conditions with the most probable time of occurrence • Gives weather within 5 NM of the centre of the runways complex • Uses the same weather coding as the METAR, although forecast times are included • Altitudes in AGL • Degrees are given in True
TAF Format • Report type: TAF or TAF AMD • Location: CYYZ • Issue Date/Time: 281139Z: 28th day @ 1139 Zulu • Period of validity: 2812/2918 – Valid from 1200 Zulu on the 28th to 1800 Zulu on the 29th • TAF CYYU 201948Z 2020/2108 30012KT 3SM -SN OVC012 TEMPO 2020/2022 P6SM SCT015 BKN030 FM202200 30010KT P6SM SCT015 BKN030 TEMPO 2022/2108 4SM –SHSN BKN015 RMK NXT FCST BY 210200Z=
TAF Format – Significant Weather • Uses the same format as the METAR • VC or ‘vicinity’ in a TAF means 5 – 10 NM • A maximum of 3 significant weather groups are allowed per forecast period • If one significant weather groups is forecast to change, all other that will exist will be indicated • CB layers will be identified with cloud groups (i.e. SCT040CB)
Change Groups • In all change groups, multiple elements are considered single entities • “SCT030 BKN050 OVC080...change indicator...BKN050” would mean that after the change indicator, there would only be a broken layer at 5000’ • FM – Permanent change (rapid) – All forecast conditions are superseded by this. FM280945 30015KT P6SM BKN030
Change Groups • BECMG – Permanent change (gradual) – When the conditions evolve over a period of time (one to two hours) BECMG 2808/2809 OVC030 • Any weather element not indicated as part of the BECMG group remains the same • TEMPO – Transitory change group – Temporary fluctuations in some or all weather elements during a specified period • TEMPO are only used if the condition is expected to last less then an hour, if more, than a time period would be given (i.e. TEMPO 2812/2815 1SM RA BR) • PROB – Probability group – Probability of alternative weather values occurring (that are considered hazards to aviation) -> PROB30 2817/2821 +TSRA
TAF CYTS 201948Z 2020/2108 33012KT 11/2SM -SHSN OVC015 TEMPO 2020/2022 P6SM NSW OVC020 FM202200 33012KT 6SM -SN FEW015 OVC040 TEMPO 2022/2102 2SM –SN OVC015 FM210200 31010KT P6SM SCT020 BKN030 TEMPO 2102/2108 4SM -SHSN BKN020 RMK NXT FCST BY 210200Z= • TAF CYTL 201948Z 2020/2108 33015KT P6SM SCT015 OVC025 TEMPO 2020/2108 2SM -SHSN BKN015 OVC030 BECMG 2102/2104 31012KT RMK FCST BASED ON AUTO OBS. NXT FCST BY 210200Z=
What is a GFA? • Series of weather charts that are adjusted for pre-flight planning in Canada • Gives the most probable weather conditions under 24,000 feet (400 mb)
Issue and Validity Periods • Issued four times daily (2330, 0530, 1130 and 1730 UTC) • Valid at 0000, 0600, 1200 and 1800 UTC • Each GFA has six charts covering 3 time periods (near-time, 6-hour and 12-hour forecasts) • Two charts issued at a time for three consecutive time periods • Two types of GFA: Clouds and Weather/Icing, turbulence and Freezing level
Areas of Coverage • Canada is divided into 7 regions: • Arctic, Yukon-NWT, Pacific, Prairie, Ontario-Quebec and Atlantic • There is an additional forecast region that is created on demand in the arctic