Download
1 / 24
240 likes | 266 Views
Estimation of parameters for simulation of steady state foam flow in porous media. Kun Ma , Sibani Lisa Biswal and George J. Hirasaki Department of Chemical & Biomolecular Engineering Rice University, Houston, TX 04/23/2012. Outline.

E N D
Estimation of parameters for simulation of steady state foam flow in porous media Kun Ma, Sibani Lisa Biswal and George J. Hirasaki Department of Chemical & Biomolecular Engineering Rice University, Houston, TX 04/23/2012
Outline • Foam simulators have many parameters. How do we determine them? • Compare the experimental results with the foam models in a commercially available reservoir simulator. • Develop methodology to describe foam mobility from common foam experiments.
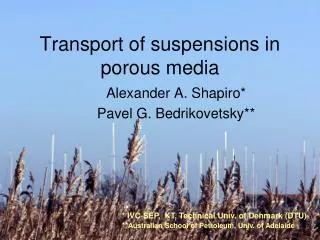
Foam in porous media ★ Foam in porous media is defined as a dispersion of gas in liquid such that the liquid phase is continuous and at least some part of the gas phase is made discontinuous by thin liquid films called lamellae1. grains Pore-level schematic of fluid distribution for foam flow2 1. Hirasaki, G. J. (1989). Journal of Petroleum Technology 41(5): 449-456. 2. Radke, C. J. and J. V. Gillis (1990). SPE Annual Technical Conference and Exhibition, 23-26 September 1990, New Orleans, Louisiana.
1-D foam experiments Sandpack: silica sand 20/40 Length: 27.5 cm Inner diameter: 2.58 cm Permeability: 158.0 darcy Porosity: 36.0% Surfactant: IOS 1518 with 1.0% wt NaCl R-CH(OH)-CH2-CH(SO3-)-R’ (~75%) R-CH=CH-CH(SO3-)-R’ (~25%), where R+R’ = C12-15
1-D foam experiments Total superficial velocity: 20 ft/day
1-D foam experiments Total superficial velocity: 20 ft/day
Foam model gas mobility reduction (1/FM) surfactant concentration (g/L) water saturation Gas mobility is a function of both water saturation and surfactant concentration. • Ashoori E, Heijden TLM, Rossen WR (2010) Fractional-Flow Theory of Foam Displacements With Oil. SPE Journal 15:pp. 260-273 • Computer Modeling Group (2007) STARSTM User's Guide. Calgary, Alberta, Canada
STARS Foam model (old) fmmob: the reference foam mobility reduction factor; fmdry: the critical water saturation (volume fraction) above which the maximum foam strength is reached; fmsurf:the critical surfactant concentration above which gas mobility is independent of surfactant concentration. • Rossen, W. R. and Renkema, W. J. (2007). Success of Foam SAG Processes in Heterogeneous Reservoirs. SPE Annual Technical Conference and Exhibition. Anaheim, California, U.S.A., Society of Petroleum Engineers.
High and low quality regime ? • Cheng, L., Reme, A. B., et al. (2000). Simulating Foam Processes at High and Low Foam Qualities. SPE/DOE Improved Oil Recovery Symposium. Tulsa, Oklahoma. • Alvarez, J. M., Rivas, H. J., et al. (2001). Unified Model for Steady-State Foam Behavior at High and Low Foam Qualities. SPE Journal 6(3).
Sw* and fmdry An example using fmmob = 12000and fmdry = 0.34: 1. Sw* is close but not equal to fmdry; 2 . Sw* can be calculated through Sw*=0.3461 fmdry=0.3400
Sw* and fmdry An example using fmmob = 12000and fmdry = 0.34: fg-Sw curve is very steep near Sw* and precise calculation of Sw* is needed. Sw*=0.3461 fmdry=0.3400 fg*
The problem to solve Solve fmmob, fmdryand Sw* through the following equations:
Using Equations (a) and (b) to determine a contour plot 1 of fg* as a function of fmmob and fmdry Using Equations (c) and (d) to determine a contour plot 2 of μfoam,app as a function of fmmob and fmdry Eqn (c) Eqn (a) Eqn (b) Eqn (d) Perform superposition of contour plots 1 and 2 and indentify the point (fmmob, fmdry) where fg*= fg,measured* in contour plot 1 and μfoam,app= μfoam, measured* in contour plot 2 cross over
Match experimental data fg=0.5 Computed from: Computed from:
Match experimental data Total superficial velocity: 20 ft/day fmmob=26800 fmdry=0.311
Revised Foam model (new) instead of fmdry in the old model
Surface tension fmsurf (hypothesized)
Conclusions • A new method of fitting the parameters in the STARS foam model is presented and a unique group of parameters is found for modeling the foam property in silica sandpack with the surfactant 0.02%-0.2% IOS 1518 in 1.0% NaCl solution. • A revised model for effect of surfactant concentration is proposed. • The critical surfactant concentration (fmsurf) in the foam model is at least one order of magnitude above the CMC.
Acknowledgment This work was financially supported by ADNOC, ADCO, ZADCO, ADMA-OPCO and PI, U.A.E.