Download
1 / 14
150 likes | 174 Views
Explore Oregon school performance in reading and math, graduation rates, funding challenges, and class size increases from 2003 to 2013. See how the state budget allocation for education has shifted and the impact on student achievement.

E N D
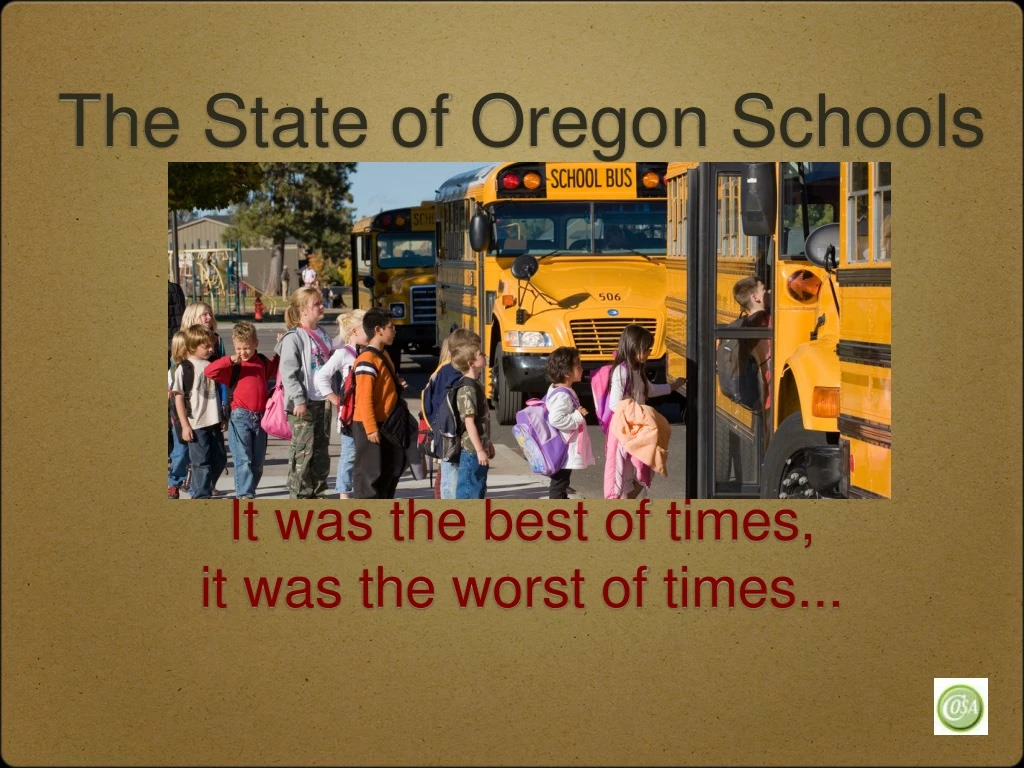
The State of Oregon Schools It was the best of times, it was the worst of times...
Reading Results Percent of Oregon students meeting or exceeding state reading benchmarks New Cut Score
Math Results Percent of Oregon students meeting or exceeding state math benchmarks New Cut Score New Cut Score
Math Results Percent of Oregon students meeting or exceeding state math benchmarks based on 2010 standards New Cut Score New Cut Score
OAKS Reading/ELA Percent of Oregon students meeting or exceeding state Reading/Language Arts benchmarks Elementary Middle School High School
OAKS Math Percent of Oregon students meeting or exceeding state Math benchmarks Note: Comparisons are not included for Elementary and Middle Schools since the standards changed in 2010-11 High School
Oregon NCES Graduation Rates The number of graduates with a regular diploma, divided by the sum of that number plus the number of students who dropped out. Includes students who take more than 4 years, does not consider a student who graduates with a modified diploma or GED.
The Challenge! Continuing Oregon’s incredible achievement gains, with significantly limited dollars!
Available State Funding Per Student Projected • ’08-09, ‘09-10, and ’10-11 include Federal Stabilization Fund Dollars