Download
1 / 24
240 likes | 388 Views
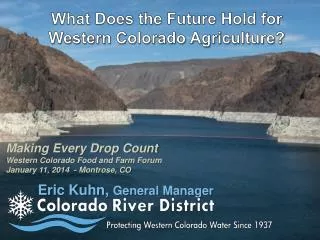
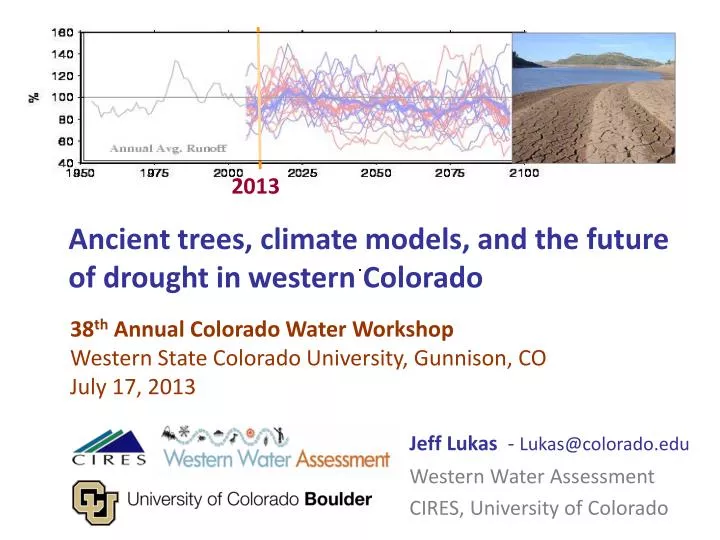
2013. Ancient trees, climate models, and the future of drought in western Colorado. 38 th Annual Colorado Water Workshop Western State Colorado University, Gunnison, CO July 17, 2013. Jeff Lukas - Lukas@colorado.edu Western Water Assessment CIRES, University of Colorado.

E N D
2013 Ancient trees, climate models, and the future of drought in western Colorado 38th Annual Colorado Water Workshop Western State Colorado University, Gunnison, CO July 17, 2013 Jeff Lukas- Lukas@colorado.edu Western Water Assessment CIRES, University of Colorado
Parsing our changing climate: a conceptual model + PRESENT FUTURE PAST PRESENT External climate forcing (Greenhouse gases, etc.) Internal (“natural, unforced”) climate variability change = PRESENT FUTURE Changing future climate
Drought: driven by precipitation deficit, exacerbated by high temperatures Middle photo: Jane Stulp
Need to look back and forwards to assess future drought risk Instrumental record Climate model projections Tree-ring record 1900 2013
20 24 18 22 16 20 14 18 12 16 Streamflow, MAF Precipitation, in. 10 14 8 12 6 10 4 Precipitation 8 2 Streamflow 6 0 1900 1910 1920 1930 1940 1950 1960 1970 1980 1990 2000 2010 Precipitation deficits and hydrological drought Western Colorado annual (water year) precipitation vs. Western Colorado naturalized runoff, 1900-2012 Precip Data: NOAA NCDC, CO Division 2 data Streamflow data: Reclamation (1906-2010); 2011-12 values estimated from preliminary Reclamation data
Western Colorado’s annual water balance – average year (MAF = million acre-feet) Precip: 40 MAF ET : -30 MAF Runoff: 10 MAF Image: D. Meko, U. of Arizona
Western Colorado’s annual water balance – drought year (MAF = million acre-feet) Precip: 30 MAF ET : -24 MAF Runoff: 6 MAF While precipitation declines only 25% vs. average year, runoff declines 40% due to ET component increasing as proportion of precipitation Image: D. Meko, U. of Arizona
1977 1983 Using tree rings to reconstruct past droughts Tree growth is typically limited by moisture availability So: – a dry year leads to a narrow growth ring – a wet year leads to a wide growth ring Douglas-fir, south San Juans, CO
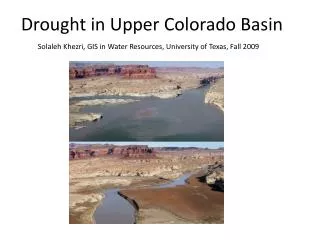
30 25 20 Annual Flow, MAF 15 10 5 0 750 1000 1250 1500 1750 2000 Tree-ring reconstructed annual flows, Colorado River at Lees Ferry, 762-2005 2002 1977, 2002: in the lowest 10 reconstructed annual flows since 762 Meko et al. 2007. Medieval Drought in the Upper Colorado River Basin, Geophysical Research Letters; data available at http://treeflow.info
18 17 16 15 14 Annual Flow, MAF 13 12 11 10 750 1000 1250 1500 1750 2000 Water Year Tree-ring reconstructed annual flows, Colorado River at Lees Ferry, 762-2005, with 20-year running mean Instrumental record
18 17 16 15 14 Annual Flow, MAF 13 12 11 10 750 1000 1250 1500 1750 2000 Water Year Tree-ring reconstructed annual flows, Colorado River at Lees Ferry, 762-2005, with 20-year running mean Mid-1100s megadrought 46 of 57 years were dry
Temperatures – Going up! Western Colorado annual temperatures - ensemble of 16 GCMs, medium emissions scenario 60°F +4ºF by 2050 50°F Observed temp. 1950 2000 2050 2100 Source: Marty Hoerling, NOAA ESRL PSD; data available from http://gdo-dcp.ucllnl.org/
Precipitation – Up? Down? Western Colorado annual precipitation – ensemble of 16 GCMs, medium emissions 32” 16” Observed precip. 2000 2100 1950 2050 Source: Marty Hoerling, NOAA ESRL PSD
50 40 30 Annual Runoff, MAF 20 10 0 1950 2000 2050 2100 Runoff – Probably down, but continued high variability! Upper Colorado River Basin annual runoff – ensemble of 16 GCMs, medium emissions Observed runoff Data: http://gis.usbr.gov/Streamflow_Projections/
Western Colorado’s annual water balance – average year, median 2050 projection (+4oF, no precip change) Precip: 40 MAF ET : -31 MAF Runoff: 9 MAF + - Even though precipitation doesn’t change, runoff declines ~10% to 9 MAF due to increasing ET Image: D. Meko, U. of Arizona
Projections for Western Colorado from all GCM runs used in the most recent studies More runoff Less runoff Median 2050 Source: Denver Water & Joint Front Range Climate Change Vulnerability Study, as printed in Kerr, Science, 25 Nov 2011
The “new normal” in a (yet) warmer climate • Increased evaporation and transpiration • More rain and less snow in fall and spring • Reduced spring snowpack • Earlier peak runoff • Reduced annual flows (unless precip gains cancel out) • Reduced summer soil moisture • Greater plant moisture stress and crop water use • These are all impacts currently associated with drought…they will occur more often in a warming climate • Any future drought will be more severe, and will tend to persist longer, for a given precipitation deficit
Don’t fixate on trend: impacts will still be most deeply felt in low-precipitation (drought) years Middle photo: Jane Stulp
Dust-on-snow also makes snow melt sooner, and probably reduces overall runoff • Already has significant hydrologic impact; likely to get worse in future with warming/drying of source regions • Impacts are in same direction as those caused by warming Photos by Chris Landry, CSAS
1950 2000 2050 2100 Future drought: expectations from tree rings, instrumental record, and climate model projections 1900 750 1000 1250 1500 1750 2000 2000
Take-home • Ancient trees tell us that the natural hydroclimatic variability is larger than the last 100 years would suggest (extreme short-term droughts & megadroughts) • The instrumental record tells us precipitation drives drought, but temperature (ET) is also a big factor • The climate models tell us that the temperature (ET) dial will continue to get turned up, but much more uncertain about precipitation • Drought conditions will likely be more frequent and severe in the future • Given the uncertainties in future climate, “scenario-based” planning is more appropriate than traditional “single-target” planning
Please contact me (lukas@colorado.edu) with questions or requests for information