Download
1 / 14
140 likes | 284 Views
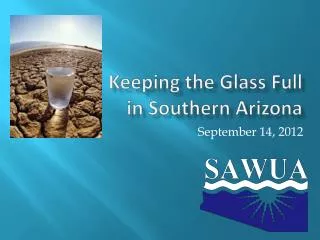
Managing Salt in Southern Arizona Water. By Justin Nixon, Dr. Robert Arnold and Dr. Wendell Ela. Department of Chemical and Environmental Engineering University of Arizona 04/18/2009. Tucson Active Management Area. Water Supply/Demand Projections. 500. 450. 400. Incidental.

E N D
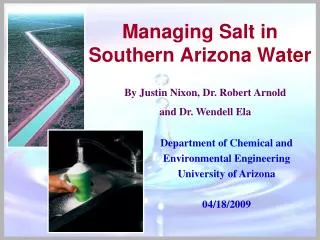
Managing Salt in Southern Arizona Water By Justin Nixon, Dr. Robert Arnold and Dr. Wendell Ela Department of Chemical and Environmental Engineering University of Arizona 04/18/2009
Tucson Active Management Area Water Supply/Demand Projections 500 450 400 Incidental Total Demand Reuse 350 300 Supply (1000s of AF) Water Reuse 250 200 CAP Delivery 150 100 50 Renewable Groundwater 0 1984 1989 1994 1999 2004 2009 2014 2019 2024 Year
Tucson Primary Water Sources Water Quality Mean Well CAP Constituent Water Water Total Dissolved Solids (mg/L) 179 806 Hardness (mg/L CaCO ) 96 322 3 Sodium (mg/L) 24 102 Calcium (mg/L) 31 75 Magnesium (mg/L) 5 31 Barium (mg/L) < 0.01 0.15 Strontium (mg/L) < 0.1 1 Chloride (mg/L) 13 94 Sulfate (mg/L) 26 256 Alkalinity (mg/L HCO ¯ ) 103 119 3 Total Organic Carbon (mg/L C ) < 1 3.1 Conversion to CAP
Salinity Impact in TAMA Arizona (all sources) : 1.0M-1.3M tons/yr TAMA (all sources) : 140,000-233,000 tons/yr TAMA (CAP only) : 85,000-190,000 tons/yr Projected TDS levels in TAMA ground waters 5-8 mg/L annual increase Research Objective: Find cost effective ways to manage salt in inland water supplies.
++ ++ SO SO + + Fe Fe FEED FEED Na Na 4 4 Concentrated Concentrated ++ ++ H H O O Mg Mg FLOW FLOW 2 2 Salts Salts ++ ++ HCO3 HCO3 Ca Ca H H O O H H O O Cl Cl 2 2 2 2 H H O O 2 2 H H H O O O H H H O O O H H H O O O 2 2 2 2 2 2 2 2 2 H H H O O O H H H O O O 2 2 2 2 2 2 H H H O O O 2 2 2 Permeate Permeate Reverse Osmosis ForSalt Separation Single RO Element RO Treatment Schematic
Sources of Membrane Scaling Amount of Water Loss: • 163 Billion Gallons per year Value of Water Loss: • $160M/year *Courtesy of Kevin Alexander, SPI
Cross-flow Filtration • High velocity fluid flow • Plate & frame; tubular; spiral-wound cartridge assembly • Unknown • Causes of membrane scaling during RO treatment of CAP water • *(images from eco-tec.com and vsep.com) Principles of RO vs VSEP • V-SEP System • Intense shear waves on the face of a membrane • Solids and foulants to be lifted off the membrane surface • Unknown • Sustainability of brine minimization at 95-99 % water recovery • *(images from vsep.com)
How VSEP Works Series LP (in P Mode): Membrane Area: 16.44 ft2 (1.58 m2) Hold-Up Volume: 0.8 gal (3 L) During closed valve period During open valve period Qfeed Qfeed Qconc = 0 Qconc closed/ open Qperm Semi-permeable membrane Qperm Semi-permeable membrane
VSEP Results Relationship of closed valve time with water recovery and permeate flux. Water recovery increases as closed valve time increases • Permeate flow rate decreases as closed valve time increases
VSEP Results Permeate Flow vs. Water Recovery Tradeoff Between Recovery and Membrane Flux Increased recovery reduces amount of permeate flow rate Must purchase additional V-SEP Machines
IX Unit RO Unit 90% Recovery Permeate 0.098 MGD TDS = TBD Removal of Barium & Calcium Influent 1 MGD 700 mg/l V-SEP Unit Concentrate 98% Recovery 0.1 MGD 6000 mg/l Brine 0.002 MGD TS ~ 10% Future Experimental Work • Optimization: MF/Ion Exchange / RO / V-SEP in series Permeate 0.9 MGD 110 mg/l
Desalination Research Facility • Slow Sand Filtration • Reverse Osmosis • Concentrate Management Participating Water Utilities
Questions? • Acknowledgements • Chris Hill (MDWID) • Mike Dew, Jeff Biggs (City of Tucson) • Martin Yoklic (ERL, U of A) • Dr. Chuck Moody, Eric Holler (BOR) • Dongxu Yan, Bob Seaman, Andrea Corral, James Lykins, Dane Whitmer, Brian McNerney (UA) • Special Thanks to Dr. Wendell Ela, Dr. Robert Arnold, and Dr. Umur Yenal (U of A)
Acknowledgement • Bureau of Reclamation • Tucson Water • Metropolitan Domestic Water Improvement District • Oro Valley Water Utility • Marana Municipal Water Department • Flowing Wells Water District • TRIF/WSP