Download
1 / 33
330 likes | 437 Views
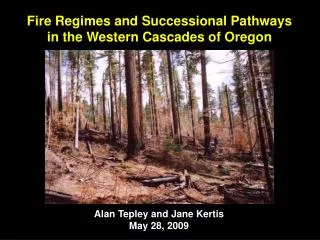
Fire Regimes and Successional Pathways in the Western Cascades of Oregon. Alan Tepley and Jane Kertis May 28, 2009. Fire Regimes in the Western Cascades as a Context for Restoration. • Fire-regime gradients in the Western Cascades – Gradients of driving factors

E N D
Fire Regimes and Successional Pathways in the Western Cascades of Oregon Alan Tepley and Jane Kertis May 28, 2009
Fire Regimes in the Western Cascades as a Context for Restoration • Fire-regime gradients in the Western Cascades – Gradients of driving factors – Location and severity of recent fires • Fire effects and successional trajectories – Warner Creek post-fire stand structure – Age structure in the central western Cascades • Topographic influences on fine-scale variability • Influence of fire-severity mosaics on subsequent burn patterns – 2008 Rattle Fire reburn of the 1996 Spring Fire
Stand-Replacement Fires 500+ yrs Stand-Replacement Fires 201–500 yrs Understory Fires 0–34 yrs Mixed-Severity Fires 0–34 yrs Fire Regimes Based on Kuchler’s Potential Natural Vegetation Types Brown et al. 2000 Wildland Fire in Ecosystems: Effects of Fire on Flora
Oregon Climate Service PRISM Project Not Modeled Annual Precipitation (cm) High < 70 70-95 95-120 Low 120-150 150-175 175-200 200-230 230-270 270-320 320-390 > 390 Density of Lightning Ignitions (1970–2002) Gradients of Fire Regime Drivers Mean Annual Precipitation (1961–1990) Data from NIFMID and ODF, Compiled by Ray Davis
1 burn 2 burns 3 burns Frequency of Large Fires (≥1,000 acres) (1970-2008) Ray Davis, Unpublished
1 burn 2 burns 3 burns Frequency of Large Fires (≥1,000 acres) (1970-2008) Dry Fire-Prone Provinces Ray Davis, Unpublished
Warner Creek 1991 8,960 acres Fire Severity Clark 2003 4,905 acres Low Moderate High Clark Warner Creek Spring 1996 15,960 acres km 0 1 2 Shady Beach 1988 5,174 acres km Shady Beach 0 1.5 3 Spring Apple Boulder Apple 2002 19,139 acres Boulder 2002 48,505 acres km 0 1.5 3 km 0 1.5 3 N km km 0 2.5 5 0 3 6 Severity of Recent Fires in the Western Cascades Kilometers 0 20 40 60
Cook-Quentin Study Area Cumulative Effects of 19th-Century Fires Cook- Quentin Clark Warner Creek Shady Beach Spring Apple Kilometers Boulder 0 30 60 90 km Morrison & Swanson 1990 0 0.5 1 High severity (> 70% mortality) Moderate severity (30–70% mortality) N Low severity (< 30% mortality) Comparison to Historical Fire Severity
Fire Severity Low 61% Moderate 13% High 25% Fire Severity Low 48% Moderate 12% High 40% Seral Stage Distribution Pre-Fire Post-Fire (%) (%) Early Seral/Rock 14 46 Sapling/Pole 9 4 Open Mature/Old 0 18 Closed Mature/Old 77 32 Seral Stage Distribution Pre-Fire Post-Fire (%) (%) Early 5 30 Mid 5 5 Late 90 65 N N Comparison of Two Recent Fires Warner Creek Fire 1991 8,960 acres Spring Fire 1996 15,960 acres Kilometers Kilometers 0 2 4 6 0 3 6 9 Kertis 2000 Kushla and Ripple 1998
100 100 100 80 80 80 60 60 60 Basal Area Mortality (%) 40 40 40 20 20 20 0 0 0 100 0 200 400 600 0 20 40 60 80 120 0 100 200 300 400 Density (stems/ha) Density (stems/ha) Density (stems/ha) Warner Creek Fire Severity was Weakly Related to Stand Structure at a Plot Scale Pre-fire Density of Small Trees (5–30 cm dbh) Pre-fire Density of Small & Medium Trees (5–60 cm dbh) Pre-fire Density of Large Trees (> 100 cm dbh) R2 = 0.010 p = 0.410 R2 = 0.024 p = 0.197 R2 = 0.002 p = 0.399 Summarized from data of Larson and Franklin (2005)
Low Severity < 30% BA Mortality (n = 31) Moderate Severity 30–70% BA Mortality (n = 23) High Severity > 70% BA Mortality (n = 14) Shade-Intolerant Shade-Intolerant Shade-Intolerant 25 70 20 20 60 Survival Survival Survival 50 15 15 40 10 10 30 20 5 5 10 0 Density (trees/ha) Density (trees/ha) Density (trees/ha) 0 0 10 5 5 20 10 30 10 40 15 50 15 20 Mortality Mortality Mortality 60 25 20 70 0 20 40 60 80 100 120 140 160 0 20 40 60 80 100 120 140 160 0 20 40 60 80 100 120 140 160 Shade-Tolerant Shade-Tolerant Shade-Tolerant 70 50 Survival 60 30 Survival Survival 40 50 20 40 30 30 20 10 20 10 10 Density (trees/ha) Density (trees/ha) Density (trees/ha) 0 0 0 10 10 10 20 20 30 20 40 30 50 40 Mortality Mortality 20 Mortality 60 70 50 160 0 20 40 60 80 100 120 140 160 0 20 40 60 80 100 120 140 160 0 20 40 60 80 100 120 140 DBH (cm) DBH (cm) DBH (cm)
Plot Burned at Low Severity Data from Jane Kertis, Prepared by Stuart Johnston
Plot Burned at Moderate Severity Data from Jane Kertis, Prepared by Stuart Johnston
Plot Burned at High Severity Data from Jane Kertis, Prepared by Stuart Johnston
Elevation (m) Transect Location High: 3,196 Low: 45 Blue River Cascades Bend the Eugene Fall Creek of Crest Oregon Warner Creek Fire Willamette National Forest N Kilometers 0 10 20 30 40 50 Study Area
Using the Past to Infer Successional Trajectories Comparing Warner Creek to Sites Burned in the 19th Century High Severity > 70% BA Mortality Low Severity < 30% BA Mortality Moderate Severity 30–70% BA Mortality 25 20 Survival 20 Survival 15 15 10 10 5 5 Density (trees/ha) 0 Density (trees/ha) 0 5 5 10 10 15 20 15 Mortality Mortality 25 20 0 40 80 120 160 160 0 40 80 120 DBH (cm) DBH (cm) 60 Survival 300 40 210 Establishment Date 250 20 Before 1800 Density (trees/ha) 200 0 After 1800 20 Density (trees/ha) 108 150 40 100 62 62 Mortality 43 60 50 7 4 0 80 120 160 0 40 0 DBH (cm) No Evidence of Fire (n = 18) Low Severity (n = 19) Moderate Severity (n = 33) High Severity (n = 15) Warner Creek post-fire data (shade-intolerant only) Sites burned in the 19th Century (shade-intolerant only)
Low Severity < 30% BA Mortality Shade-Intolerant 25 12 20 Survival Shade Tolerants (n = 340 trees) 8 15 10 4 % of Sampled Trees 5 0 0 Density (trees/ha) Shade Intolerants (n = 103 trees) 4 5 10 0 1500 1600 1700 1800 1900 2000 15 20 Mortality 25 0 20 40 60 80 100 120 140 160 30 Shade-Tolerant 20 10 Survival 30 0 20 % of Sampled Trees 1500 1600 1700 1800 1900 2000 30 10 20 Density (trees/ha) 0 10 10 0 1500 1600 1700 1800 1900 2000 20 Establishment Date Mortality 20 Shade-Intolerant Shade-Tolerant 0 20 40 60 80 100 120 140 160 with charred bark Hardwood DBH (cm) Succession Following Low-Severity Fire Composite for 19 Sites 2 Representative Transects
No Evidence of 19th-Century Fire (composite of 18 transects) 12 Shade Tolerants (n = 304 trees) 8 4 % of Sampled Trees 0 Shade Intolerants (n = 106 trees) 4 0 1500 1600 1700 1800 1900 2000 Establishment Date 19th-Century Low-Severity Fire (composite of 19 transects) 12 Shade Tolerants (n = 340 trees) 8 4 % of Sampled Trees 0 Shade Intolerants (n = 103 trees) 4 0 Shade Intolerant 1500 1600 1700 1800 1900 2000 Shade- Tolerant Establishment Date Shade- Intolerant with charred bark Effects of Low-Severity Fire
Moderate Severity 30–70% BA Mortality (n = 23) Shade-Intolerant 20 Survival Composite of 33 Transects 15 12 10 Shade Tolerants (n = 528 trees) 8 5 Density (trees/ha) 4 0 % of Sampled Trees 5 0 Shade Intolerants (n = 350 trees) 10 4 15 0 Mortality 1500 1600 1700 1800 1900 2000 20 0 20 40 60 80 100 120 140 160 25 Shade-Tolerant 2 Representative Transects 20 50 15 Survival 10 40 5 30 0 20 1500 1600 1700 1800 1900 2000 10 % of Sampled Trees Density (trees/ha) 0 50 40 10 30 20 20 10 30 0 40 Mortality 1500 1600 1700 1800 1900 2000 Shade-Intolerant 50 Shade-Tolerant Establishment Date 160 0 20 40 60 80 100 120 140 with charred bark Hardwood DBH (cm) Succession Following Moderate-Severity Fire
High Severity > 70% BA Mortality (n = 14) Composite of 15 Transects Shade-Intolerant 12 70 Shade Tolerants (n = 196 trees) 60 Survival 8 50 40 4 30 % of Sampled Trees 0 20 10 Shade Intolerants (n = 193 trees) 4 Density (trees/ha) 0 10 0 20 30 1500 1600 1700 1800 1900 2000 40 50 Mortality 60 70 2 Representative Transects 0 20 40 60 80 100 120 140 160 Shade-Tolerant 30 70 20 60 Survival 50 10 40 0 30 % of Sampled Trees 1500 1600 1700 1800 1900 2000 20 10 Density (trees/ha) 0 10 20 30 40 40 30 50 Establishment Date Mortality 20 60 Shade-Intolerant 70 10 Shade-Tolerant 160 0 20 40 60 80 100 120 140 0 with charred bark Hardwood DBH (cm) 1500 1600 1700 1800 1900 2000 Succession Following High-Severity Fire
Low- Severity Fire Moderate- Severity Fire High-Severity Fire Western hemlock Douglas-fir (> 200 yrs old) Douglas-fir (< 200 yrs old) Western redcedar Successional in Douglas-fir Forests Stand Development
Stand Development Underburn Low-severity fire Moderate-severity fire Western hemlock Douglas-fir (> 200 yrs old) Douglas-fir (< 200 yrs old) Western redcedar Successional Pathways in Douglas-fir Forests 1-4 Decades Since Fire 100–200 Years Since Fire 300–500 Years Since Fire
Composite of 13 Transects 12 Shade Tolerants (n = 104 trees) 8 4 % of Sampled Trees 0 Shade Intolerants (n = 202 trees) 4 0 1500 1600 1700 1800 1900 2000 2 Representative Transects 30 20 % of Sampled Trees 10 30 0 20 1500 1600 1700 1800 1900 2000 10 0 1500 1600 1700 1800 1900 2000 Establishment Date Shade-Intolerant Shade-Tolerant with charred bark Hardwood Age Structure of Fire-Prone Stands with at least 3 Douglas-fir Cohorts
No evidence of fire for > 350 yrs (composite of 18 transects) 12 Shade Tolerants (n = 304 trees) 8 4 % of Sampled Trees 0 Shade Intolerants (n = 106 trees) 4 0 1500 1600 1700 1800 1900 2000 Establishment Date At least 3 fires in the last 400 yrs (composite of 13 transects) 12 Shade Tolerants (n = 104 trees) 8 4 % of Sampled Trees 0 Shade Intolerants (n = 202 trees) 4 Shade Intolerant 0 Shade- Tolerant 1500 1600 1700 1800 1900 2000 Shade- Intolerant with charred bark Establishment Date Comparison of Stand and Age Structure in the Most and Least Fire-Prone Sites
0.5 Ridgetop Elevation (m) 700 800 0.4 Composite of 18 transects 900 1,000 12 0.3 Shade Tolerants (n = 304 trees) 1,100 8 Probability of Occurrence 1,200 4 0.2 1,300 % of Sampled Trees 0 1,400 Shade Intolerants (n = 106 trees) 1,500 0.1 4 1,600 0 1500 1600 1700 1800 1900 2000 0.0 Establishment Date 210 0 30 60 90 120 150 180 Terrain Shape Concave Convex Shade-Intolerant Shade-Tolerant Topographic Context for Stands with no Evidence of Fire for at Least 350 yrs
Probability of Occurrence < 0.05 0.05–0.10 0.10–0.15 0.15–0.20 0.20– 0.25 0.25–0.30 0.30–0.35 0.35–0.40 0.40–0.45 0.45–0.50 Kilometers 0 3 6 9 12 Transect Location Present All Other Transects N N N Probability of Occurrence for the Least Fire-Prone Stands Blue River Kilometers 0 3 6 9 12 Fall Creek Kilometers 0 5 10 15 20
0.5 Ridgetop Elevation (m) 0.4 0.3 700 12 Probability of Occurrence 0.2 800 18 24 900 Composite of 13 transects 0.1 12 1,000 30 Shade Tolerants (n = 104 trees) 36 1,100 8 0.0 1,200 42 3350 3820 4290 4760 5230 5700 4 1,300 48 % of Sampled Trees Insolation 0 54 1,400 Shade Intolerants (n = 202 trees) 1,500 60 4 0.4 Slope Gradient (%) 0 1,600 66 1500 1600 1700 1800 1900 2000 0.3 Establishment Date Probability of Occurrence 0.2 0.1 Shade-Intolerant 0.0 Shade-Tolerant 3350 3820 4290 4760 5230 5700 with charred bark Insolation Topographic Context for the Most Fire-Prone Stands
Probability of Occurrence < 0.05 0.05–0.10 0.10–0.15 0.15–0.20 0.20–0.25 0.25–0.30 0.30–0.35 0.35–0.40 Blue River 0.40–0.45 0.45–0.60 Kilometers Kilometers 0 0 3 3 6 6 9 9 12 12 Fall Creek Present All Other Transects N N N Kilometers 0 5 10 15 20 Probability of Occurrence for the most Fire-Prone Stands Transect Location
Spring Fire Severity Clearcut High Severity Low Severity Moderate Severity Natural Opening Road Spring Fire 1996 15,960 acres
Spring Fire Severity Clearcut High Severity Low Severity Moderate Severity Natural Opening Rattle Fire Perimeter Road Rattle Fire 2008 19,771 acres
Spring Fire Severity September 14 September 15 2,202 acres burned September 16 4,182 acres burned Clearcut High Severity Low Severity September 17 3,069 acres burned Moderate Severity Natural Opening Road The Biggest Fire Days 48% of the Rattle Fire (9,453 acres) burned from 9/14 to 9/17
Summary and Conclusions • An understanding of fire-regime gradients is useful in guiding restoration Increasing • annual precipitation • mean fire intervals • proportion of fire covered by large high-severity patches • influence of fuel moisture on fire extent and severity Increasing • proportion of landscape covered by multi-cohort stands • average number of cohorts per stand • proportion of fire covered by large low-severity patches • influence of fuel amount and continuity on fire extent and severity