2.4 Million
250 likes | 429 Views
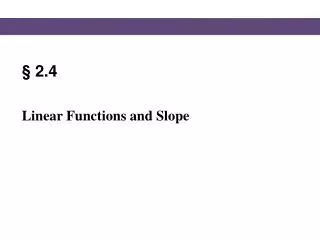
2.4 Million. Student Absences in Central Texas per Year. Source: E3 Alliance analysis of PEIMS data at UT Education Research Center; 2010-2011 school year. Central Texas Has More Absences Than Texas on Average at Every Grade. +3 days.

2.4 Million
E N D
Presentation Transcript
2.4 Million Student Absences in Central Texas per Year Source: E3 Alliance analysis of PEIMS data at UT Education Research Center; 2010-2011 school year.
Central Texas Has More Absences Than Texas on Average at Every Grade +3 days Source: E3 Alliance analysis of PEIMS data at the UT Austin Education Research Center
½ Central Texas Students Miss 6+ Days/Year & Account for 85% of all Absences Source: E3 Alliance analysis of PEIMS data from 2009-10 at UT Education Research Center
History • Following state funding cuts in 2011, E3 Alliance asked superintendents, “How can our community help?” • The resounding answer: a regional attendance campaign • So we launched Missing School Matters • E3 Alliance calculated a 2% increase in attendance per year would generate $34 million annually for schools Because schools are reimbursed by the State for daily attendance
History & Facts • In Spring 2012, we launched a regional outreach campaign, primarily through large employers • In Fall 2012, a national in-school attendance challenge called “Get Schooled” was initiated in our schools • 5 Central Texas schools were in the top 25 nationwide! Stony Point HS, Leander HS, Covington MS, Garcia MS, Simon MS • Now, the MSM Task Force is expanding the attendance initiative with a general awareness campaign
Our Goal: Increase student attendance by 2 percentage points (average 3 days/student) 34 $ more students achieve million
MISS SCHOOL. MISS OUT. When your son or daughter misses a day at school, they’re missing out on a lot more than classes or homework. They’re missing opportunities. Opportunities to learn. To gain confidence. To be inspired. To be a friend. To experience a moment that may have a positive impact.
But that’s not all. They’ll also start to miss out on things like teachers, electives, sports programs and arts education. Because every year, school absences cost Central Texas $34 million in lost revenue. That $34 million translates into 600 teachers or equipping 17,000 Central Texas science classrooms with lab equipment and supplies.
What Can YOU Do? • Keep your own child in school unless they are contagious • Request a speaker from us for your next meeting – • Take this message to your PTA, your HOA, your clubs. Let more people know that Missing School Matters! • Put an article in your company newsletter • Download a poster, and put it up at your business • Post it on Facebook or Tweet our message • Share the Attendance Parent Guide with friends • Be a part of the solution!
Resources www.missingschoolmatters.org Facebook.com/missingschoolmatters Twitter.com/missingmatters www.e3alliance.org www.getschooled.com
The conclusions of this research do not necessarily reflect the opinions or official position of the Texas Education Agency, the Texas Higher Education Coordinating Board, or the State of Texas. Thank You! www.e3alliance.org
Missing School Matters Taskforce • Galvanize education champions to execute a focused awareness campaign • Outreach to parents, community groups • Spread the word that ‘Missing School Matters’ via strategic, measurable activities
Task Force Accomplishments + Future Focus • Outreach is growing • Round Rock ISD PTA Council • YMCA • Community Health Clinics/Doctors • Austin Police Dept. • Big Brothers Big Sisters, Boys & Girls Club • And more… • Spreading the word • Social media channels • E-newsletters • In-person meetings and presentations • Still have work to do – We need you! • Spread the word
Our Studies Show Where to Concentrate Efforts • 7th-10th graders (transition to High School) • For low income students, absences not due to illness • Students with absences due to chronic illness • Students with absences due to skipping Conclusions based on E3 Alliance analysis of absence reason data from 9 schools in PISD & HCISD, 1/14/13-3/8/13
Absence Reasons Study • Which students miss school, where and why? • First of its kind study in the state (maybe US?) • Funded by St. David’s Foundation, Central Health • Data to drive regional decision-making How health and community systems interact with student attendance and achievement • Collected absence reasons for 2 months in Hays, Pflugerville • Designed to be representative of regional population
Top 10 Reasons for Absence: 72% of Absences (8124) Source: E3 Alliance analysis of absence data from 9 schools in PISD & HCISD, 1/14/13-3/8/13
Medical Absences More Variable Than Non-Medical Absences Over Time Source: E3 Alliance analysis of Absence data from 9 schools in PISD & HCISD, 1/14/13-3/8/13
Low Income Students Have More than Their Share of Non-Medical Absences % of Students who are Low Income Source: E3 Alliance analysis of Absence data from 9 schools in PISD & HCISD, 1/14/13-3/8/13
Overall Conclusions • Absence reasons to concentrate community services • Chronic illness • Skipping • Non-illness absences for low income students • 7th-10thgrade • Nearly half of absences due to acute illness • Amount of health related absences vary over time • Amount of non-health related absences relatively consistent over time • Geographical location of hotspots vary widely by absence reason