Analysis of Spectral & Spatial Data from EPIC Observations of MCG-6-30-15 & 3C 273 using XRT Point Spread Function
This study focuses on the analysis of spectral and spatial data obtained from EPIC observations of MCG-6-30-15 and 3C 273 using the XRT Point Spread Function (PSF). The research involves examining the extreme low-energy features, King+Gaussian PSF profiling, power-law index variations, and radius normalization dependencies. The analysis includes redoing spectral analysis with altered King profiles, exploring parameter space in PSF dependencies, and developing software for fitting King profiles to images. The results show different PSF dependencies for various instruments and energy bands, indicating the energy dependence of PSF parameters. The study also compares new PSFs with existing ones and discusses improvements in slope fits and normalization. Testing new PSFs in various observations reveals the importance of accurate PSF modeling for precise spectral analysis.

Analysis of Spectral & Spatial Data from EPIC Observations of MCG-6-30-15 & 3C 273 using XRT Point Spread Function
E N D
Presentation Transcript
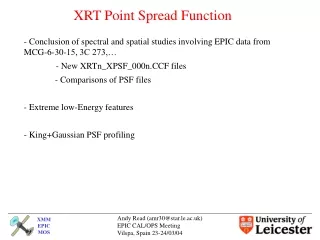
XRT Point Spread Function - Conclusion of spectral and spatial studies involving EPIC data from MCG-6-30-15, 3C 273,… - New XRTn_XPSF_000n.CCF files - Comparisons of PSF files • Extreme low-Energy features • King+Gaussian PSF profiling
Very bright point source – ~ 300 ks, low pile-up, low-BG, singles spectra (2-10keV) extracted from different annuli MCG-6-30-15 Power-law index vs. Radius Normalization vs. Radius Radius (pixels: 1.1”)
King PSFs in the CCF MOS 1 _________ A PSFKING(r) = α [1+(r/r0)²] r0 ON-AXIS -Analysis of King Profile PSF in CCF - Core Radius R0 and slope alpha show strong energy dependence APPROACH 1 - Redo entire spectral analysis using altered King profiles with various R0-E and Alpha-E dependencies - Initial results suggested a far flatter energy dependence is required ON-AXIS α
MOS 2 PN ON-AXIS ON-AXIS ON-AXIS ON-AXIS
PSF=CCF(KING) Alpha vs R Norm. vs R MCG-6-30-15 o o o o
PSF=CCF(HIGH-ACC) Alpha vs R Norm. vs R (no energy dependence) MCG-6-30-15 original boundary!
MCG-6-30-15 APPROACH #1 - Exploration of parameter space in King profile R0- and Alpha-dependence --- Alter CCF files (XPSF, extension 70 [King], just on-axis values) --- Redo entire analysis (3 observations, 3 instruments, 8 spectra/ARFs) --- Re-alter CCF files (XPSF) and repeat… - Number of these searched-for (S) PSF dependencies give good results e.g. MOS1 R0=4.5 (constant with E) alpha=1.45-1.36 (decreasing with E) MOS2 R0=4.5 (constant with E) alpha=1.45-1.36 (decreasing with E) PN R0=5.0 (constant with E) alpha=1.65-1.38 (decreasing with E) …(also more complex dependencies can give even better results…)
PSF=Best-S(earched) Alpha vs R Norm. vs R MCG-6-30-15 o o o o
PSF=CCF(KING) Alpha vs R Norm. vs R MCG-6-30-15 o o o o
PSF=S(earched) Alpha vs R Norm vs R MCG-6-30-15
PSF=CCF(King) Alpha vs R Norm vs R MCG-6-30-15
MCG-6-30-15 APPROACH #2 - Data of sufficient quality to calculate PSFs in small energy bands - Development of software to fit King profiles to images - See how these King profiles compare to those in the CCF - Use these King profile PSFs in the spectral analysis
Examples of King profile fits to narrow-band images MCG-6-30-15 PN Rev 301 3 keV MOS1 Rev 303 6 keV
PSF King-profile fitting results - MGC06 MOS1 Exposure-weighted Best S(earch) ON-AXIS CCF
MCG06 MOS2 Best S(earch) ON-AXIS CCF
MCG06 PN Best S(earch) ON-AXIS CCF
PSF=CCF(KING) Alpha vs R Norm. vs R MCG-6-30-15 o o o o
PSF=King-Fit Alpha vs R Norm. vs R MCG-6-30-15 o o o o
PSF=Best-S Alpha vs R Norm. vs R MCG-6-30-15 o o o o
PSF=AMR1 Alpha vs R Norm. vs R MCG-6-30-15 o o o o
CCF(King) MOS 1 AMR1(King) [distr. 17/12/03] r0 α
CCF(King) MOS 2 AMR1(King) [distr. 17/12/03] r0 α
CCF(King) PN AMR1(King) [distr. 17/12/03] r0 α
3C273 18 M1/M2 SW Obs. PSF=CCF(King) PSF=AMR1 Power-law index vs radius | | | | | | | | | | | Radius (1.1″ pixels)
3C273 PSF=CCF(King) PSF=AMR1 Normalization vs radius | | | | | | | | | | | Radius (1.1″ pixels)
Testing new PSFs (Distributed 17/12/03) Independent study [RDS] PKS 0558-504 [Rev 84] inner 5″[MOS], 10″[PN] excluded SASccf AMR1 0.2-2 keV 2-10 keV 0.2-2 keV 2-10 keV Slope Flux Slope Flux Slope Flux Slope Flux M1 3.08 2.07 1.95 9.19 3.10 2.10 2.03 8.77 M2 3.07 2.13 1.95 9.60 3.09 2.16 2.04 9.10 PN 3.05 1.90 2.04 7.64 3.08 2.22 2.15 8.12 AMR1 fluxes agree better for both energy ranges χ² better for low-E fit High-E still not too good, though may be due to non-PSF effects
Testing new PSFs Independent study [RDS] Very bright transient, inner 20″ excluded SASccf AMR1 1-9 keV 1-9 keV Slope Flux Slope Flux M2 1.62 9.57 1.76 9.24 PN 1.74 8.45 1.77 8.32 Diff 0.12 13% 0.01 11% Massive improvement in slope fit Still a normalization problem (though perhaps a non-PSF effect)
Testing new PSFs Independent study [RDS] – Mkn205 PN M1 M2 Radii Slope Flux Slope Flux Slope Flux 0-10 1.72±0.02 5.47±0.13 1.75±0.06 6.05±0.58 1.85±0.04 5.98±0.27 0-20 1.70±0.02 5.54±0.12 1.75±0.05 6.17±0.59 1.78±0.05 5.95±0.50 0-40 1.70±0.02 5.54±0.12 1.73±0.05 6.18±0.52 1.80±0.04 6.00±0.21 0-60 1.72±0.02 5.53±0.09 1.73±0.05 6.26±0.53 1.82±0.04 6.03±0.22 0-120 1.70±0.02 5.82±0.14 1.72±0.04 6.45±0.24 1.77±0.04 6.46±0.25 5-40 1.72±0.02 5.52±0.15 1.73±0.06 6.02±0.69 1.78±0.05 5.77±0.28 10-60 1.71±0.03 5.53±0.24 1.72±0.06 6.33±0.52 1.72±0.07 6.20±0.65 20-80 1.73±0.09 6.09±1.19 1.72±0.10 6.48±0.83 1.86±0.09 6.61±0.63 Slopes consistent (except perhaps for M2 0-10″) Fluxes OK (except for 0-120″ - poor BG subtraction or faint extended emission)
Comparison of PSFs: Enclosed Energies M1 SASccf M2 PN • Enclosed energy versus energy @ 25″ • SASccf PSFs
Comparison of PSFs: Enclosed Energies M1 AMR1 M2 PN • Enclosed energy versus energy @ 25″ • AMR1 PSFs
Comparison of PSFs: Enclosed Energies M1 M2 PN • Ratio of enclosed energy (AMR1/SASccf) versus energy @ 25″
Comparison of PSFs: Enclosed Energies M1 M2 PN • Ratio of enclosed energy (AMR1/SASccf) versus energy @ 45″
Comparison of PSFs: Enclosed Energies M1 M2 PN • Ratio of enclosed energy (AMR1/SASccf) versus energy @ 70″
Reducing the PN EE? • Choose the high end of the R0 values (~6.0) and the low end of the α values (~1.56) • Gives rise to lower EE (80-81% @25″) • Are the spectral results still OK? …
PSF=260204 Alpha vs R Norm. vs R MCG-6-30-15 o o o o
PSF=AMR1 Alpha vs R Norm. vs R MCG-6-30-15 o o o o
Extreme Low-Energy Features • Analysis of low-E (<250eV M1/M2 spectra in radial annuli (0-30 pixels [1 pixel=1.1″]) • Annulus 1 [6-12] 2 [12-18] 3 [18-24] 4 [24-30] + comparison with centre - Centres obtained via Gaussian fitting to images 30 pixels(1.1 ″) 24 18 12 6
Relatively fewer low-E events at larger radius Variation of spectrum with radius Rev 0094 (3C273) MOS1 MOS2 R=0-6 Ann.1 6-12/0-6 Ann.2 12-18/0-6 Ann.3 18-24/0-6 Ann.4 24-30/0-6
M1 [soft] shows effect more than M2 [hard] Variation of spectrum with radius Rev 0303(MCG06-30-15) MOS1 MOS2 R=0-6 Ann.1 6-12/0-6 Ann.2 12-18/0-6 Ann.3 18-24/0-6 Ann.4 24-30/0-6
Ann.1 • Rel. fewer low-E events at large-R • M1 [soft] effected more than M2 [hard] Hardness ratio [HR] versus Rev for Annuli 1-4 Ann.2 • Value 1: spectrum same as at centre • Relative deficit in extreme low-E photons seen to increase with radius • Effect appears less prominent at later revolution number Ann.3 Ann.4
Ann.1 Hardness ratio [HR] versus Rev for Annuli 1-4 for one source (3C273) Ann.2 • Again, effect less prominent at later revolution number Ann.3 Ann.4
Ann.1 Hardness ratio [HR] versus central hardness ratio [HR0] for Annuli 1-4 Ann.2 • Value 1: spectrum same as at centre • Just the soft spectrum sources (low HR0) that show the relative deficit of low-E photons effect - These are mainly M1 • Very soft sources have lots of direct extreme low-E photons (i.e. small %age of redistributed photons). • Low-E photons in hard sources may be nearly all redistributed • Likely a PSF effect that is the cause – (e.g. a more compact ex.low-E M1 PSF) Ann.3 Ann.4
Ratio of M1 central hardness ratio [HR0] to M2 central hardness ratio versus Rev • i.e. effect of very different spectral shapes (e.g. Rev0094 3C273) • Difference appears to get less at later revolutions • Explainable if redistribution is getting worse with rev – Increasing redistribution is diluting the effect of different ex.low-E PSFs – At later Revs, relatively more <160eV photons are redistributed, rather than arriving directly.
Ex.Low-E PSFs for M1 & M2 • Using stacked 0301-0303 MCG06-30-15 observations • < 160 eV and 160-250 eV • M1 <160 eV PSF is indeed more compact! <160 eV 160-250 eV R0 α R0 α M1 5.1 1.8 4.9 1.6 M2 4.0 1.5 4.3 1.5
Effects of low-E changes? M1 - Added ex.low-E changes to AMR1 PSF (shown left [M1, theta=0]) • Effects (e.g. spectral) expected only to appear at very low energies (<250eV) • However, large effects observed at large energies (2keV, 5keV)!
Effects of low-E changes? M1 M1 • Analysis shows that spline fitting to points has gross effects far from low energy regions - High-energy effective area values subsequently effected
Effects of low-E changes? M1 M1 -Tiny changes to individual point values can lead to sensible spline fits • No changes above ~250eV • General warning that interpolations may not be giving what we expect • Also CAL interpolation may be different from e.g. my interpolation
PSF King+Gaussian [KG] Fitting • King fits sometimes underestimate the PSF profile at the very centre _________ A -Cr² PSFKG(r) = + Be α [1+(r/r0)²] ↑ ↑ KING + GAUSSIAN • Would require new software [CAL, arfgen etc…] to access it
PSF King+Gaussian [KG] Fitting • e.g. M1 100 eV • Large Gaussian component required (ratio of normalizations 25±1%)
PSF King+Gaussian [KG] Fitting • e.g. PN 3000 eV • Very small (~0) Gaussian component required (ratio of normalizations 1±1%) • PN’s larger pixels insensitive to the very core of the PSF