Download
1 / 35
350 likes | 466 Views
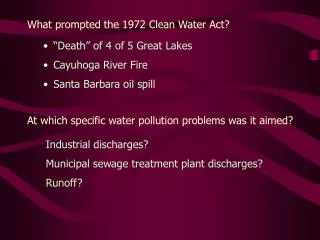
STATISTICS and the CLEAN WATER ACT Public Law 92-500, October 18, 1972. N. Scott Urquhart Department of Statistics Colorado State University Fort Collins, CO 80523-1877. OUTLINE FOR TODAY. Status of our waters before any legislation Legislative history

E N D
STATISTICSand theCLEAN WATER ACTPublic Law 92-500, October 18, 1972 N. Scott UrquhartDepartment of Statistics Colorado State University Fort Collins, CO 80523-1877
OUTLINE FOR TODAY • Status of our waters before any legislation • Legislative history • Statistical issues in past implementation of the CWA • EPA’s Environmental Monitoring and Assessemt Program (EMAP) • CSU’s STARMAP and its research
STATUS OF OUR WATERS BEFORE MUCH LEGISLATION • A little boy moved to a Colorado mountain town mid-winter, 1949. • As the snow melted in the Spring, he went exploring. • Landlady said not to go along the river behind the house where he was living. • What better reason to go there? • He stepped in an open sewer running directly into the river!
Time Magazine, August 1, 1969 (about a month after “the” fire) An article dramatized the state of the Cuyahoga: • Some river! Chocolate-brown, oily, bubbling with subsurface gases, it oozes rather than flows. • 'Anyone who falls into the Cuyahoga does not drown,' Cleveland's citizens joke grimily. 'He decays.' • The Federal Water Pollution Control Administration dryly notes: 'The lower Cuyahoga has no visible life, not even low forms such as leeches and sludge worms that usually thrive on wastes.' It is also--literally--a fire hazard. • A few weeks ago, the oil-slicked river burst into flames and burned with such intensity that two railroad bridges spanning it were nearly destroyed. • 'What a terrible reflection on our city,' said Cleveland Mayor Carl Stokes sadly.
This photo from the photographic collection of the Cleveland Public Library depicts a fire in December of 1952 on the Cuyahoga River. Time Magazine ran this photo in its article "The Cities: The Price of Optimism" from its August 1, 1969 issue. The article brought national attention to the pollution of the Cuyahoga River, but it mislead readers to believe that this picture was of the June 22, 1969 fire, when in fact it, was not.
THE FABLE OF THE CUYAHOGA RIVER BURNING • The fire began at 11:56 a.m. on a stretch of the Cuyahoga River just southeast of downtown Cleveland. • The ignited floating oil slick was extinguished in just over twenty minutes, but not before the fire damaged two key railroad trestles. • A bridge belonging to the Norfolk & Western Railway Co. sustained $45,000 in damage as the oil slick passed under it. Both tracks on the bridge had to be closed. The railroad tracks were noticeably warped, while the railroad ties were charred. • The other bridge, the Newburgh & South Shore Railroad bridge, withstood $5,000 of damage, as support timbers were scorched.
THE 1950s and 1960s • I thought I was going to tell you about how deplorable a condition our waters had become by 1970. • Frankly, the cities, counties and states had begun a substantial environmental cleanup effort by 1970 • Often not recognized • Opposed by vested interests • TIME article galvanized public opinion • Result: Clean Water Act of 1972
FURTHER INFORMATION ON THIS HOAX, SEE • http://www.cwru.edu/artsci/engl/marling/60s/pages/richoux/TheFire.html
LEGISLATIVE HISTORY • Federal Water Pollution Control Act first passed in 1956. • Water Quality Act of 1965 • Clean Water Restoration Act of 1966 • Water Quality Improvement Act of 1970 • The Federal Water Pollution Control Act Amendments of 1972 • Replaced the language of earlier acts • Commonly known as theClean Water Act • Signed by Richard Nixon • Many subsequent amendments
ECOLOGY and the CLEAN WATER ACT • The Clean Water Act (CWA) Specifically Mentions Aquatic Life As • “… the protection and propagation of a balanced indigenous population of shellfish, fish and wildlife, • and to allow recreational activities …” • Statements like this occur at least 28 times in the CWA sections numbered 3xx • Ecology covers this class of interests!
WHAT DID THE CLEAN WATER ACT DO? • Provided federal assistance for • Sewer systems • Water treatment plants • Also required for permits for discharges into waters • Delegated responsibility for initial enforcement to the states • But if the states didn’t do it, EPA would
RELEVANT SECTIONS FOR TODAY • Sec. 305. Water Quality Inventory • (b) (1) Each State shall prepare and submit to the Administrator … biennially … • a report which shall include – • a description of the water quality of all navigable waters in such State during the preceding year, • (2) The Administrator shall transmit such State reports, together with an analysis thereof, to Congress … biennially thereafter.
RELEVANT SECTIONS FOR TODAY continued • Sec. 303. Water Quality Standards and Implementation Plans. • (d) (1) (A) Each State shall identify those waters within its boundaries for which the effluent limitations required by section 301(b)(l)(A) and • … are not stringent enough to implement any water quality standard applicable to such waters. … • The State shall establish a priority ranking for such waters, taking into account the severity of the pollution and the uses to be made of such waters. • (2) Each State shall submit … the waters identified and the loads established … • such State shall incorporate them into it a current plan {to mitigate the effect}
NATIONAL EXTENT OF WATERS • How many lakes, streams and rivers are the states suppose to report on? • Source – National Hydrographic Data Set (NHD) • A successor to EPA’s RF3 • River Reach File version 3 • Blue lines on 1:100,000 series of maps • Published by the United States Geologic Survey • Lets stick with the lower 48 states, because Alaska nearly doubles extent, and is poorly mapped
EXTENT OF STREAM KILOMETERS • What is your guess? • Map traces identified as perennial? • 2.1 million kilometers (~1.25 million miles) • Map traces identified as intermittent? • 3.2 million kilometers (~1.9 million miles) • Classification error rate? (In the West) • ~20% coded perennial are nonperennial • ~10% coded nonperennial are perennial • Blue lines are? See this map later.
STATISTICAL ISSUES IN PAST IMPLEMENTATION OF THE CWA • NO CRITERIA for how States were to select waters on which to report! • (How should such data be combined across Sates?) • State’s sites often reflected data gathered in response to some complaint. • Thus EPA’s Office of Water contended • The actual condition of the Nation’s waters is substantially better than reported.
IMPETUS FOR EPA’S ENVIRONMENTAL MONITORING AND ASSESSMENT PROGRAM (EMAP) • “What do you mean you don’t know how many acid lakes there are?” • William Ruckelshaus - EPA Administrator - early 1980s • “Good News - Based on my years in the environmental movement, I think the Agency does an exemplary job of protecting the nation’s public health and quality of the environment.” • “Bad News - I can’t prove it.” • William Reilly - EPA Administrator - 1989
Fully Supporting 13% Not Supporting 13% STATE A Not Supporting 87% Fully Supporting 87% Probability Survey Traditional Targeted Monitoring Not Supporting 5% Not Supporting 25% STATE B Fully Supporting 95% Fully Supporting 75% Probability Survey Traditional Targeted Monitoring IMPORTANCE OF EMAP-TYPE DESIGNS Condition of a State’s streams using different designs
EMAP • Principles: • Define the population of interest. • Develop a usable sampling frame for IT. • And sample IT. • Develop relevant measures. • Train field crews thoroughly. • Exercise solid QA. • Have and use a solid data retrieval system. • Learn from your mistakes.
EMAP – STATISTICAL TOOLS • Classical finite population sampling • Focuses on a list – not continuous • Assume enough knowledge of the response to allow meaningful stratification. • Interesting ecological resources are located in space – no list • Not well enough understood to allow meaningful stratification. • Water flows in channels • Distance needs to be measures “as the fish swims”, not “as the bird flies.”
EMAP – STATISTICAL TOOLS - II • Developed Generalized Random Tessellation Sampling (GRTS) • Spatially balanced • Variable density • Supports replacement of unusable points • Nontarget • Physically inaccessible • Access denied • No evaluation needed – see next slide
CLIFF AT MILE 135.2(PARTIAL HEIGHT) NO VEGETATION TRANSECT NEEDED HERE! EMAP SITE SELECTION PROTOCOL ACCOMMODATES THIS, WHEREAS TRADITIONAL METHODS DON’T.
CSU’s STARMAP MAJOR OBJECTIVES • TO ADVANCE • THE SCIENCE OF STATISTICS • TECHNIQUES OF HIERARCHICAL SURVEY DESIGN AND ALLIED TECHNIQUES • SPATIAL AND TEMPORAL MODELING • TO DEVELOP AND EXTEND THE EXPERTISE ON DESIGN AND ANALYSIS TO THE STATES AND TRIBES
STARMAP’S MAJOR OBJECTIVESCONTINUED • TO EXPAND THE CADRE OF GRADUATES WITH • EXPERTISE AND EXPERIENCE IN • SURVEY DESIGN AND ANALYSIS • NEEDED TO SUCCESSFULLY MONITOR THE CONDITION OF • THE NATION’S AQUATIC RESOURCES • http://www.stat.colostate.edu/starmap/
STARMAP PROJECTS • Combining Environmental Data Sets • Local Estimation = “Small Area” estimation • Developing Environmental Indicators • GIS tool development • Outreach and Extension • Learning materials relative to environmental sampling and analysis
STARMAP PROJECTS - EXAMPLES • Ranalli, M.G., F.J. Breidt, and H. Wang. Low-rank Smoothing Splines on Complex Domains. Seminar, Atlantic Ecology Division, EPA, Narragansett, RI. March 1, 2005. • Measuring distance “as the fish swims”
STARMAP PROJECTS – EXAMPLE II Spatial statistical models for predicting water quality impairment on stream networks • Ver Hoef, J.M., E. Peterson, and D.T. Theobald. Spatial statistical models that use flow and stream distance. To appear in Environmental and Ecological Statistics • Objective: Predicting the likelihood of water quality impaired stream reaches; Developing GIS and spatial modeling methodologies for stream networks • Example: Maryland Stream Survey
Expected Results: • A geostatistical model • Predict a specific reach scale condition at points that were not sampled • Provide a better understanding of the relationship between the landscape and reach scale conditions • Give insight into potential sources of water quality degradation • Develop landscape indicators • Crucial for the rapid and cost efficient monitoring of large areas • Better understanding of spatial autocorrelation in stream networks • What is the distance within which it occurs? • How does that differ between chemical variables? • Products: • Map of the study area • Shows the likelihood of water quality impairment for each stream segment • Based on water quality standards or relative condition (low, medium, high) • Future sampling efforts can be concentrated in areas with a higher probability of impairment • Methodology • Illustrates how States and Tribes can complete spatial analysis using GIS data and field data • GIS tools will be available
This research is funded by U.S.EPA – Science To Achieve Results (STAR) Program Cooperative Agreement # CR - 829095 FUNDING ACKNOWLEDGEMENT The work reported here today was developed under the STAR Research Assistance Agreement CR-829095 awarded by the U.S. Environmental Protection Agency (EPA) to Colorado State University. This presentation has not been formally reviewed by EPA. The views expressed here are solely those of presenter and STARMAP, the Program he represents. EPA does not endorse any products or commercial services mentioned in this presentation.
End of prepared presentation Questions are welcome! See http://www.stat.colostate.edu/starmap/publications/ And many related talks, reports, etc