Download
1 / 30
300 likes | 481 Views
Metropolitan Nashville Police Department. Hermitage Precinct. Hermitage Precinct 3701 James Kay Ln Hermitage TN 37076. Hermitage Precinct Boundaries. The Hermitage Precinct covers approx. 110 square miles of Davidson County. Workload and Efficiency of Staff. 2006 Year-End Statistics

E N D
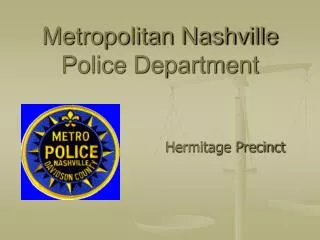
Metropolitan Nashville Police Department Hermitage Precinct
Hermitage Precinct Boundaries The Hermitage Precinct covers approx. 110 square miles of Davidson County.
Workload and Efficiency of Staff • 2006 Year-End Statistics • Highly-motivated employees are performing at historic rates! • There were 2.02 sworn officers per 1,000 residents, the lowest since 1992 • According to USDOJ Bureau of Justice Statistics, cities the size of Nashville have 2.74 officers per 1,000 • There were 607 Calls For Service per sworn officer, the highest ratio in department history • There were 35.8 UCR offenses per sworn officer, the lowest since 1989 • Since 1990 the population of Davidson County has grown by 20%, officer staffing has grown by 20%, BUT workload per officer has grown 75% • For the years 2004, 2005, 2006, compared to 2003, 2002 and 2001, individual officer SELF- INTIATED activity is UP 70% • 2007 YTD Self-Initiated activity is up another 25%
Zone 535 Auto Burglaries(activity is shown for the last 28 days)
Zone 535 Residential Burglaries(activity is shown for the last 28 days)
Zone 535 Traffic Stops(activity is shown for the last 28 days)
Zone 535 Arrest Activity(activity is shown for the last 28 days)
How are Community Problem Solving Techniques Evaluated? CompStat (Comparing Statistics) • What’s working…..Why? • What is not working…..Why? • If it’s not working, how do we or should we fix it? • What new strategies should be implemented?
Truancy Operation Results *Two day operation by our dayshift Flex Team* The Flex Team was able to charge a grand total of (29) subjects with (31) misdemeanor offenses. Of those offenses, (24) charges were for Loitering During School Hours, (3) for underage tobacco possession, (1) Traffic arrest, (1) Disorderly Conduct, and (2) were for contributing to the delinquency of a minor.
Other Units that assist Hermitage Precinct • Gangs • Mission One • Operation Safer Streets • K-9 • Aviation • SRT
Community Involvement • Neighborhood Watch Groups • Neighborhood Participation • promoting neighborhood changes • Being good neighbors / “watching out” for each other • Being informed and involved on neighborhood issues • Involvement in criminal investigation proceedings as necessary • Providing information / cooperating with police Politically Informed/Involved
Dispatch Times • Factors that Affect Response Times Number of Officers on Duty Volume of calls received Types of calls Received (large emergencies require a higher number of officers to respond, and reduces the amount of available officers). Time of Day (Non emergency calls during peak traffic hours increases travel time.) High number of calls in a small geographical area. Court time / Special assignments Weather (rain, ice/snow, fog, etc.) Call Priority levels
Workload and Efficiency of Staff • 2006 Year-End Statistics • Highly-motivated employees are performing at historic rates! • There were 2.02 sworn officers per 1,000 residents, the lowest since 1992 • According to USDOJ Bureau of Justice Statistics, cities the size of Nashville have 2.74 officers per 1,000 • There were 607 Calls For Service per sworn officer, the highest ratio in department history • There were 35.8 UCR offenses per sworn officer, the lowest since 1989 • Since 1990 the population of Davidson County has grown by 20%, officer staffing has grown by 20%, BUT workload per officer has grown 75% • For the years 2004, 2005, 2006, compared to 2003, 2002 and 2001, individual officer SELF- INTIATED activity is UP 70% • 2007 YTD Self-Initiated activity is up another 25%