Initial Analysis of SS7 Signaling Load and Performance in Zain Tanzania (2008)
480 likes | 620 Views
This report analyzes the SS7 signaling load and performance of Zain Tanzania's network in 2008. High utilization rates on BSC links and trunk groups indicate congestion that could lead to call losses. The analysis shows low success rates for SMS, paging, and handover processes, with urgent need for further investigations and data collection. Proposed solutions include increasing link capacities and optimizing load-sharing mechanisms. Key trends and areas needing attention are highlighted to enhance service quality and operational efficiency.

Initial Analysis of SS7 Signaling Load and Performance in Zain Tanzania (2008)
E N D
Presentation Transcript
Zain Tanzania Initial Analysis Ehsan ElRahmanDoaa Abdelatif (c) 2008
SS7 signalling Load • SS7 Load Highlights: • High utilization in more than 22% of links • Most of the highly utilized links are showing high utilization almost all over the day. • Mainly the BSC links are highly utilized, HLR link load is normal. • Some Links with BSC are highly overloaded, which may cause call loss. • In and out link load of some SCP links are not properly distributed ( Load sharing issue) • Link Busy hours found in between 20th to 22nd every day. (c) 2008
SS7 signalling Load • Proposed solutions: • Increase Link Capacity between BSCs and MSCs • Proper Load sharing mechanisms • Information required for more investigations: • SS7 network design • Signaling routing Plan (c) 2008
SMS Analysis • Highlights • Low Success rate • Lowest MS to MSC Success rate (72% to 66%) in MSS04 and MSS08 • Lowest MSC to MS delivery success rate in MSS05 (c) 2008
SMS Analysis • Proposed solutions: • Shall be after instigations • Information required for more investigations: • Measurements from SMSC to identify SMS failure causes (c) 2008
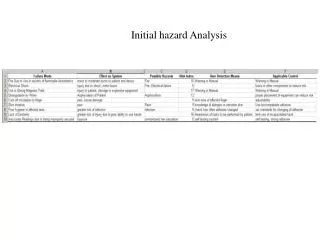
TG – Analysis TG with over 75% utilization: • TG With Congestion: • High incoming congestion (30% to 70%): B4BW3TI-B4BW3TO of MSS05 • High outgoing congestion (28% to 75%): B4BW3TI-B4BW3TO of MSS05 Some other TG with above 1% to 30% congestion (c) 2008
Switching Capacity and GoS (c) 2008
Switching Capacity- Subs Sudden decrease on 23 Nov, more investigation is required (c) 2008
Switching Capacity- Subs Sudden decrease on 23 Nov, more investigation is required, more data on following days may be required (c) 2008
Switching Capacity- Subs Sudden decrease on 23 Nov, more investigation is required, more data on following days may be required (c) 2008
Switching Capacity- Subs (c) 2008
Switching Capacity- Subs (c) 2008
Switching Capacity- Subs Sudden decrease on 23 Nov, more investigation is required, more data on following days may be required (c) 2008
Switching Capacity- Subs (c) 2008
Switching Capacity - BHCA (c) 2008
Switching Capacity - BHCA (c) 2008
Switching Capacity - BHCA (c) 2008
Switching Capacity – CP Load (c) 2008
Switching Capacity – CP Load (c) 2008
Switching Capacity Highlights • ALL MSCs has free capacity as CP Load is less than 50% • According to data, the total capacity is less than carried on DSMSS03, DSMSS04, DSMSS05, DSMSS06, DSMSS07, DSMSS08, DSMSS09 . This required more clarification on definition or there is discrepancy • More data required for trend • More information required to evaluate low number of subs on 22/11 & 23/11 (c) 2008
Paging Failure Rate (c) 2008
Paging Failure Rate (c) 2008
Paging Failure Rate (c) 2008
Paging Failure Rate (c) 2008
Paging Failure Rate (c) 2008
Paging Failure Rate • Highlights • Failure rate is too high, max value of failure rate is on average 17-32% ( Average on network is 27%), i.e Paging Success rate on the network as an average is almost 73% • More investigations and Analysis for paging are required • Some MSCs has no data at all (c) 2008
Location Updates Success rate (c) 2008
Location Updates Success rate (c) 2008
Location Updates Success rate (c) 2008
Location Updates Success rate (c) 2008
Location Updates Success rate (c) 2008
Location Updates Success rate • Highlights • LU Success rate is too low, it varies between 83-95% on most of MSCs( Average on network is about 92%), • More investigations and Analysis for paging are required • Some MSCs has no data at all (c) 2008
Handover Success rate( OC) (c) 2008
Handover Success rate (OC) (c) 2008
Handover Success rate (OC) (c) 2008
Handover Success rate (OC) (c) 2008
Handover Success rate (OC) (c) 2008
Handover Success rate( IC) (c) 2008
Handover Success rate (IC) (c) 2008
Handover Success rate (IC) (c) 2008
Handover Success rate (IC) (c) 2008
Handover Success rate (IC) (c) 2008
Handover Success rate • Highlights • HO Success rate is too low, it varies between 76-91% on most of MSCs( Average on network is about 84%), • More investigations and Analysis for HO are required ( handover per cell, handover per BSC, per LAC,..etc) • Some MSCs has no data at all (c) 2008
Missing Data • All data is not collected on same dates /time . This required to collect data for complete 1 week at Busy Hour • No Data From Astelia • No Drive Test or Benchmarking Data • Missing network design and traffic information according to the attached file ( green is missing in existing data and shall be considered when new data is collected (c) 2008
Summary of Initial Analysis • High Utilization on Signaling Links • High Utilization on trunk groups • Low Paging Success Rate • Low LU Success rate • Low HO Success rate (c) 2008
Recommendation • Run a new data collection for 1 week • Meet customer and discuss the following: • Target Value of KPIs ( HO, LU, CSSR, call setup delay,…) • Benchmarking with competitors • Review Initial network plan and design • Analysis of the new data • Recommendation ( Short Term/Long term) (c) 2008
References • ITU Signaling & Traffic related standards To be filled • 3GPP related Quality standards To be filled • Ericsson related design guidelines To be filled • Contracted KPIs values To be filled (c) 2008
Thank You (c) 2008