Mastering Information Graphics: Engaging Data Visualization Techniques
Exploring the art of information graphics, this guide emphasizes the power of visual communication over verbal data presentation. Effective visualizations enable users to use their intuition to draw meaningful conclusions from complex datasets. Interactivity is crucial, allowing users to modify and explore data dynamically through visual tools such as pop-ups and animations. This resource covers best practices in organizing data, employing Gestalt principles, utilizing preattentive variables, and creating a user-centric experience that enhances understanding and engagement with data.

Mastering Information Graphics: Engaging Data Visualization Techniques
E N D
Presentation Transcript
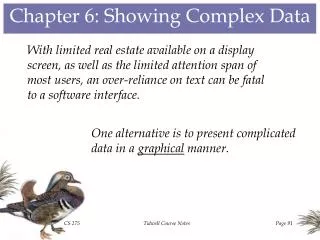
Trees, Tables, and other information graphics Showing Complex Data
Art of Information Graphics • Communicate visually rather than verbally • Show rather than tell • User’s can use their eyes and minds to draw their own conclusions • When done well can be much more effective than displaying verbal data, especially for complex data sets
Power of Interactivity • We are dealing with computers not printed information • Use pop-ups, animation, etc to hide and show information to the user • Let the user modify, sort, etc – describe the data as they see fit to increase their ability to comprehend the data set. • Make the user a participant in the information discover process
Good Interactive Information Graphics • Clearly shows how the data is organized • Clearly shows what is related to what • Clearly shows how to explore the data • Clearly shows how the data can be rearranged • Shows only what is needed to be known • Allows the user to determine specific data values
Data Relationships • What’s Related to What • Preattentive Variables? • Visual features that convey information before the view pays conscious attention to them • Gestalt principles of similarity and continuity are most often use to convey these relationships
Navigating and Exploring the Data • Scroll and Pan • Drag or Scroll the viewable area until a point of interest is visible • Zoom • Change the scale of the viewed section or point of interest • Open and close points of interest • Expand/Collapse to points of detail and interest • Drill down into points of interest • Drilldown/drillup to points of detail and interest
Sorting and Arrangement of Data • Choosing a good sort value, or letting the user define it, can by a good method of arranging data in a useful manner • Common types of sort: Alpha, Numeric, Date, Time, Location, Category/Tag, Popularity, Custom, etc
Sorting and Arrangement of Data Sorted by Location (Alpha) Sorted by Value
Searching and Filtering the Data • Highly Interactive • Respond quickly to user’s searching and filtering • Iterative • User refines search, query, filter until the result set is ideal • Contextual • Shows results in context with surrounding data to make it easier for a user to understand
Showing Specific Data Values • Labels • Values shown directly in graphic • Names on a Map, Values on a chart, etc • Legends • Legends are used when color, texture, linestyle, symbol, etc, represent the data values in the graphic • Axes, Rulers, Scales, Timelines • Used when position represent values • Datatips • Labels on mouse hover, tab, or other focus • Data Brushing • Allows selecting a subset of data in the graphic to see how it fits or relates to data in other contexts
Common Patterns • Power Tools • Overview Plus Detail • Datatips • Dynamic Queries • Data Brushing • Local Zooming • Tables and Lists • Row Striping • Sortable Table • Jump to Item • New-Item Row • Hierarchical Data • Trees • Cascading Lists • Tree Table • Multidimensional Data • Multi-Y Graph • Small Multiples • Treemap
Overview Plus Detail • Place an overview graphic new to a zoomed “detail view” • Best used when you want to user to see both the big picture and details of a portion of interest • User here don’t need to see all details at once • Zoomed region is typically movable in overview section
Data Tips • As the mouse rolls over points of interest, put the data values or additional information into a tooltip or floating window • Best used when you are showing an overview of the total data, but the graphic represents or has data behind what is shown • Data tips can be a quick and rewarding form of interactivity
Dynamic Queries • Provide ways to filter the data set immediately and interactively • Best used when data set is large and contains many variables and/or categories • Sliders and checkboxes often work well as controls to filter
Data Brushing • Let the user select data items in one view and show the same data selected in another view • Best used when you have two or more information graphics at a time. • Provides the ability to see a select group of points or items mapped against another metric or region
Data Brushing http://vitagate.itn.liu.se/projects/GAV/demovideos/VDE/VDE.html
Data Brushing http://vitagate.itn.liu.se/projects/GAV/demovideos/CoRelation/CoRelation.html
Local Zooming • Show data in a single page. Allow the mouse to select and area which in turn distorts the page and makes those data items large and readable • Best used when data set is some type of organizational form – plots, maps, networks, tables • Can include rearranging the data to show detail or fisheye zooming which enlarges a section without altering surrounding content
Local Zooming Distorted Layout
Local Zooming Fish Eye Zooming
Row Striping • Use two similar shades to alternately color the backgrounds of table rows • Best used when a table’s row are difficult to separate visually • Often occurs when there are two many columns with various types or data or images • Colors should be low saturation and similar in hue
Row Striping Clearly Better?
Sortable Table • Show data in a table and let the user sort the table rows according to column values • Best used when the interface contains many variable types the user may want to explore, group by, reorder, etc.
Jump to Item • When user begins to type, jump to that item in the list or table • Best used when the interface uses a scrolling list, table, drop down, combo box or tree to present a long set of items that are usually sorted by alpha • Keystrokes within a certain time interval (~200ms) are often honored to drive deeper into the name path
Cascading Lists • Express a hierarchy by showing selectable lists of items at each level • Selection of an item shows that item’s children in subsequent list • Best used when your data is tree shaped but the hierarchy is deep and/or broad. A treeview would not work as well here due to the vast amount of scrolling that may be induced
Tree Table • Put hierarchical data in columns, as you would a table; but use an indented outline and controlling structure as would be seen in a tree • Best used when you want to show hierarchical data represented by a tree, but need to show more information than the item name itself. • Can be used for sub-sorting in some cases
Multi-Y Graph • Stack multiple graphs vertically and let them share the same X-axis • Y-axis for each graph represents a different metric • Best used when you want to show two or more graphs or data sets that share a common trait such as timeline
Small Multiples • Create many small pictures of the data using two or three dimensions • Tile them on a page according to one or two additional data dimensions • Best used when you need to display a large data set with more than two dimensions or over multiple variables over regular intervals