Supply & Demand
Learn the Law of Demand and Law of Supply, graphing techniques, determinants, and how they affect market equilibrium. Practice problems included.

Supply & Demand
E N D
Presentation Transcript
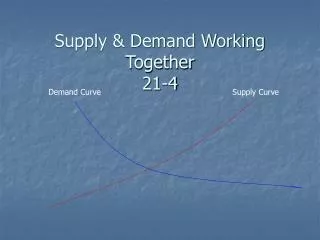
Supply & Demand The Product Market
LAW OF DEMAND An inverse relationship exists between price and quantity demanded • As Price Falls… …Quantity Demanded Rises • As Price Rises… …Quantity Demanded Falls
LAW OF DEMAND • Demand Curve • Market Demand • Individual Demand • Horizontal Summation
DOWNWARD SLOPE • Diminishing Marginal Utility
DOWNWARD SLOPE • Diminishing Marginal Utility • Income Effect
DOWNWARD SLOPE • Diminishing Marginal Utility • Income Effect • Substitution Effect
P QD GRAPHING DEMAND Price of Corn P $5 4 3 2 1 Plot the Points CORN 10 20 35 55 80 $5 4 3 2 1 o Q 10 20 30 40 50 60 70 80 Quantity of Corn
P QD GRAPHING DEMAND Price of Corn P $5 4 3 2 1 Plot the Points CORN 10 20 35 55 80 $5 4 3 2 1 o 55 Q 10 20 30 40 50 60 70 80 Quantity of Corn
P QD GRAPHING DEMAND Price of Corn P $5 4 3 2 1 Plot the Points CORN 10 20 35 55 80 $5 4 3 2 1 o Q 10 20 30 40 50 60 70 80 35 Quantity of Corn
P QD GRAPHING DEMAND Price of Corn P $5 4 3 2 1 Plot the Points CORN 10 20 35 55 80 $5 4 3 2 1 o Q 10 20 30 40 50 60 70 80 Quantity of Corn
P QD GRAPHING DEMAND Price of Corn P $5 4 3 2 1 Plot the Points CORN 10 20 35 55 80 $5 4 3 2 1 o Q 10 20 30 40 50 60 70 80 Quantity of Corn
P QD GRAPHING DEMAND Price of Corn P $5 4 3 2 1 Connect the Points CORN 10 20 35 55 80 $5 4 3 2 1 D o Q 10 20 30 40 50 60 70 80 Quantity of Corn
P QD GRAPHING DEMAND Price of Corn What if Demand Increases? P $5 4 3 2 1 CORN 10 20 35 55 80 $5 4 3 2 1 D o Q 10 20 30 40 50 60 70 80 Quantity of Corn
P QD GRAPHING DEMAND Price of Corn Increase in Quantity Demanded P $5 4 3 2 1 CORN 30 40 60 80 + 10 20 35 55 80 $5 4 3 2 1 Increase in Demand D2 D1 o Q 10 20 30 40 50 60 70 80 Quantity of Corn
P QD GRAPHING DEMAND Price of Corn What if Demand Decreases? P $5 4 3 2 1 CORN 10 20 35 55 80 $5 4 3 2 1 D o Q 10 20 30 40 50 60 70 80 Quantity of Corn
P QD GRAPHING DEMAND Price of Corn P Decrease in Quantity Demanded $5 4 3 2 1 CORN -- 10 20 40 60 10 20 35 55 80 $5 4 3 2 1 Decrease in Demand D1 D3 o Q 10 20 30 40 50 60 70 80 Quantity of Corn
DETERMINANTS OF DEMAND • Tastes (Preferences) • Prices of Related Goods • Substitutes & Complements • Unrelated Goods • Income • Normal (Superior) & Inferior Goods • Number of Buyers • Expectations
DETERMINANTS OF DEMAND • Tastes (Preferences) • Prices of Related Goods • Substitutes & Complements • Unrelated Goods • Income • Normal (Superior) & Inferior Goods • Number of Buyers • Expectations
Practice Problems • Activity 1-4 Parts A & B • Activity 1-5
LAW OF SUPPLY A direct relationship exists between price and quantity supplied • As Price Rises… …Quantity Supplied Rises • As Price Falls… …Quantity Supplied Falls
P QS GRAPHING SUPPLY Plot the Points Price of Corn P $5 4 3 2 1 CORN $5 4 3 2 1 60 50 35 20 5 o 5 Q 10 20 30 40 50 60 70 80 Quantity of Corn
P QS GRAPHING SUPPLY Plot the Points Price of Corn P $5 4 3 2 1 CORN $5 4 3 2 1 60 50 35 20 5 o Q 10 20 30 40 50 60 70 80 Quantity of Corn
P QS GRAPHING SUPPLY Plot the Points Price of Corn P $5 4 3 2 1 CORN $5 4 3 2 1 60 50 35 20 5 o 35 Q 10 20 30 40 50 60 70 80 Quantity of Corn
P QS GRAPHING SUPPLY Plot the Points Price of Corn P $5 4 3 2 1 CORN $5 4 3 2 1 60 50 35 20 5 o Q 10 20 30 40 50 60 70 80 Quantity of Corn
P QS GRAPHING SUPPLY Plot the Points Price of Corn P $5 4 3 2 1 CORN $5 4 3 2 1 60 50 35 20 5 o Q 10 20 30 40 50 60 70 80 Quantity of Corn
P QS GRAPHING SUPPLY Price of Corn P S $5 4 3 2 1 CORN $5 4 3 2 1 60 50 35 20 5 Connect the Points o Q 10 20 30 40 50 60 70 80 Quantity of Corn
P QS GRAPHING SUPPLY Price of Corn P What if Supply Increases? S $5 4 3 2 1 CORN $5 4 3 2 1 60 50 35 20 5 o Q 10 20 30 40 50 60 70 80 Quantity of Corn
P QS GRAPHING SUPPLY Price of Corn Increase in Supply P S2 S1 $5 4 3 2 1 CORN 80 70 60 45 30 $5 4 3 2 1 60 50 35 20 5 Increase in Quantity Supplied o Q 10 20 30 40 50 60 70 80 Quantity of Corn
P QS GRAPHING SUPPLY Price of Corn P What if Supply Decreases? S $5 4 3 2 1 CORN $5 4 3 2 1 60 50 35 20 5 o Q 10 20 30 40 50 60 70 80 Quantity of Corn
P QS GRAPHING SUPPLY Decrease in Supply Price of Corn S3 P S1 $5 4 3 2 1 CORN 45 30 20 0 -- $5 4 3 2 1 60 50 35 20 5 Decrease in Quantity Supplied o Q 10 20 30 40 50 60 70 80 Quantity of Corn
DETERMINANTS OF SUPPLY • Resource Prices • Prices of Other Goods • Technology • Taxes & Subsidies • Expectations • Number of Sellers
DETERMINANTS OF SUPPLY • Resource Prices • Prices of Other Goods • Technology • Taxes & Subsidies • Expectations • Number of Sellers
Practice Problems • Activity 1-6 Parts A & B • Activity 1-7
DETERMINANTS OF SUPPLY Combining with Demand • Resource Prices • Technology • Taxes & Subsidies • Prices of Other Goods • Price Expectations • Number of Sellers
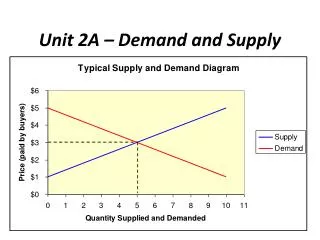
P QD P QS MARKET DEMAND & SUPPLY Price of Corn P CORN MARKET CORN MARKET S $5 4 3 2 1 2,000 4,000 7,000 11,000 16,000 $5 4 3 2 1 $5 4 3 2 1 Market Clearing Equilibrium 12,000 10,000 7,000 4,000 1,000 D 7 o Q 2 4 6 8 10 12 14 16 Quantity of Corn
P QD P QS MARKET DEMAND & SUPPLY Price of Corn P CORN MARKET CORN MARKET S Surplus $5 4 3 2 1 At a $4 price more is being supplied than demanded 2,000 4,000 7,000 11,000 16,000 $5 4 3 2 1 $5 4 3 2 1 12,000 10,000 7,000 4,000 1,000 D 7 o Q 2 4 6 8 10 12 14 16 Quantity of Corn
P QD P QS MARKET DEMAND & SUPPLY Price of Corn P CORN MARKET CORN MARKET S $5 4 3 2 1 At a $2 price more is being demanded than supplied 2,000 4,000 7,000 11,000 16,000 $5 4 3 2 1 $5 4 3 2 1 12,000 10,000 7,000 4,000 1,000 Shortage D 11 7 o Q 2 4 6 8 10 12 14 16 Quantity of Corn
P QD P QS MARKET DEMAND & SUPPLY Price of Corn P CORN MARKET CORN MARKET S Surplus $5 4 3 2 1 2,000 4,000 7,000 11,000 16,000 $5 4 3 2 1 $5 4 3 2 1 12,000 10,000 7,000 4,000 1,000 Shortage D 11 7 o Q 2 4 6 8 10 12 14 16 Quantity of Corn
MARKET EQUILIBRIUM • Equilibrium Price & Quantity • Rationing Function of Prices • Changes in Demand • Changes in Quantity Demanded • Changes in Supply • Changes in Quantity Supplied
Single Shifts • Supply Increases • Supply Decreases • Demand Increases • Demand Decreases
Double Shifts • Supply Increases & Demand Decreases • Supply Decreases & Demand Increases • Supply Increases & Demand Increases • Supply Decreases & Demand Decreases
Double Shifts Quantity Price ? • Supply increase; Demand decrease • Supply decrease; Demand increase • Supply increase; Demand increase • Supply decrease; Demand decrease ? ? ?
Welfare Economics • Welfare economicsis the study of how the allocation ofresources affects economic well-being. • Market equilibrium maximizes the total welfare of buyers and sellers.
CONSUMER SURPLUS • Consumer surplus is the buyer’s willingness to pay for a good minus the amount the buyer actually pays for it.
A Consumer surplus P1 B C Demand Q1 How the Price Affects Consumer Surplus (a) Consumer Surplus at Price P Price Quantity 0
A Initial consumer surplus C Consumer surplus P1 B to new consumers F P2 D E Additional consumer Demand surplus to initial consumers Q1 Q2 How the Price Affects Consumer Surplus (b) Consumer Surplus at Price P Price Quantity 0
PRODUCER SURPLUS • Producer surplus is the amount a seller is paid for a good minus the seller’s cost.
Supply B P1 C Producer surplus A Q1 How the Price Affects Producer Surplus (a) Producer Surplus at Price P Price 0 Quantity