Download
1 / 1
20 likes | 243 Views
J.Cox 1 , R.Stewart 1 , C. Lin 1 , V. Turcotte 2 , B.Kochtubajda 3 , 1 McGill University, Montreal,QC, Canada 2 Meteorological Service of Canada (MSC), Quebec Region, St.Laurent, QC, Canada

E N D
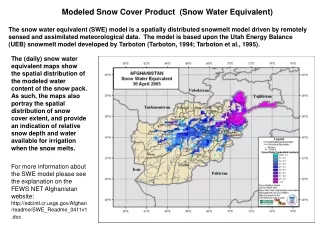
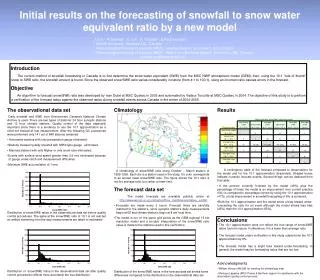
J.Cox1, R.Stewart1, C. Lin1, V. Turcotte2, B.Kochtubajda3, 1 McGill University, Montreal,QC, Canada 2 Meteorological Service of Canada (MSC), Quebec Region, St.Laurent, QC, Canada 3 Meteorological Service of Canada (MSC), Prairie and Northern Region, Edmonton, AB, Canada jessica.cox@mail.mcgill.ca Initial results on the forecasting of snowfall to snow water equivalent ratio by a new model Introduction The current method of snowfall forecasting in Canada is to first determine the snow water equivalent (SWE) from the MSC NWP atmospheric model (GEM); then, using the 10:1 “rule of thumb” snow to SWE ratio, the snowfall amount is found. Since the observed snow/SWE ratio varies considerably in nature (from 4:1 to 100:1), using an incorrect ratio causes errors in the forecast. Objective An algorithm to forecast snow/SWE ratio was developed by Ivan Dubé at MSC Quebec in 2003 and automated by Viateur Turcotte at MSC Quebec in 2004. The objective of this study is to perform a verification of the forecast ratios against the observed ratios during snowfall events across Canada in the winter of 2004-2005. • The observational data set • Daily snowfall and SWE from Environment Canada’s National Climate Archive is used. There are two types of stations: 24 hour synoptic stations and 12 hour climatic stations. Quality control of the data especially important since there is a tendency to use the 10:1 approximation as a short-cut instead of real measurement. After the following QC procedures were performed only 141 out of 848 stations remained. • Automated stations with only precipitation gauge eliminated. • Stations measuring daily snowfall with SR50 type gauge eliminated. • Manned stations with only Nipher or only snow ruler eliminated. • Events with surface wind speed greater than 5.5 m/s eliminated because of gauge under-catch and measurement difficulties. • Minimum SWE accumulation of 1 mm. • Distribution of snow/SWE ratios in the observational data set before quality control procedures. The spike at the snow/SWE ratio of 10:1 is not real but an artifact stemming from the way measurements are taken or estimated. • Distribution of snow/SWE ratios in the observational data set after quality control procedures reflects more accurately the true distribution. • Climatology • A climatology of snow/SWE ratio using October – March season of 1989-1995. Each dot is a station used in the study. It’s color corresponds to an annual mean snow/SWE ratio. The figure shows the 10:1 ratio is not the average ratio, but rather a lower limit. • The forecast data set • The model forecasts are available publicly online at dfdghttp://www.wul.qc.ec.gc.ca/meteo/Prev_maritime/animateur_e.html. • Forecasts are made every 3 hours. Forecast times are carefully matched to the station’s, since synoptic station’s daily measurements begin at 6Z and climate station’s begin at 8 am local time. • The model is run on the same grid points as the GEM regional 15 km resolution model and a bi-cubic interpolation of the snow/SWE ratio value is made to the stations used in this verification. • Distribution of the snow/SWE ratios in the forecast data set shows some differences compared to the distribution in the observational data set. • Results • A contingency table of the forecast compared to observations for the model and for the 10:1 approximation (bracketed). Shaded boxes indicate correctly forecast events. Several things can be deduced from this table: • If the percent correctly forecast by the model (48%) plus the percentage of times the model is an improvement over current practice (5%) is compared to percentage correct by using the 10:1 approximation (47%) a total improvement in snowfall forecasting of 6% is achieved, • Both the 10:1 approximation and the model show a bias toward under-forecasting the ratio for an event although the model shows less bias (45%) than the 10:1 approximation (65%). • Acknowledgments • William Henson (McGill) for creating the climatology map. • Monique Lapalme (MSC Prairie & Northern region) for assistance with the observation quality control process. • Conclusions • The 10:1 approximation does not reflect the true range of snow/SWE ratios found in nature. Furthermore, it is a lower than average ratio. • The forecast model under verification in this study outperforms the 10:1 approximation by 6%. • The forecast model has a slight bias toward under-forecasting. In general, the model may be forecasting ratios that are too low.