Download
1 / 31
310 likes | 412 Views
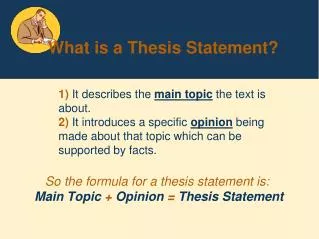
A model is a formal statement of a theory. Components of a theory or economic model:. Variables are measures that can change over time or across observations. Assumptions regarding relationships among variables. Implications Testable hypotheses.

E N D
Components of a theory or economic model: • Variables are measures that can change over time or across observations. • Assumptions regarding relationships among variables. • Implications • Testable hypotheses
Ockham’s razor is … ... the proposition that irrelevant details in theories (models) should be eliminated. • The value of a model or theory derives from its ability to explain the world around us.
The Scientific method entails evaluating whether models and theories are consistent with empirical evidence. • Models and theories that conflict with the evidence are either discarded or amended to be consistent.
The King’s Game: I’m the King and your job is to entertain me. Use the scientific method to develop and refine a theory regarding the rule I used to order the cards in a deck.
King’s Game • 2 of hearts • 3 of clubs • 4 of hearts • 6 of spades • 7 of diamonds • 8 of spades • J of diamonds • Q of clubs • K of hearts • Ace of clubs • 5 of hearts • 2 of spades
Two Roles of Economists • When they are trying to explain the world, they arescientists. • When they are trying to change the world, they arepolicymakers.
Positive versus Normative Analysis • Positive statementsare statements that describe the world as it is. • Normative statementsare statements about how the world should be.
Positive or Normative Statements? An increase in the minimum wage will cause a decrease in employment among the least-skilled.
Positive or Normative Statements? The income gains from a higher minimum wage are worth more than any slight reductions in employment.
Why Economists Disagree • They may disagree on theories about how the world works. • They may hold different values and, thus, different normative views.
Production is the process of using inputs to make goods and services available.
These inputs or factors of production are ... • Labor, referring to all human resources. • Land, referring to all natural resources, including the environment. • Capital, meaning the durable goods that have been produced and in turn are used to produce other goods and services. • Intermediate inputs, meaning goods that have been produced and, in turn, are used up in the production process.
Technology is the knowledge of how inputs can be used to produce goods and services.
Production Possibilities Model • Quantity and quality of inputs are fixed. • Two outputs: food (F) and clothing (C). • Technology is fixed. • Some inputs are relatively better adapted to the production of one good rather than the other.
The production possibility frontier (PPF) shows the maximum quantity of one good that can be produced given fixed quantities of all the others. Production Possibilities Food Clothing a 0 15 b 1 14 c 2 12 d 3 9 e 4 5 f 5 0
An allocation of resources is efficient in production if it is not possible to produce more of one good without producing less of some other good.
Insights from the PPF model • Scarcity ... The quantities of the goods that can be produced fall short of what is desired . • Choice …There are mutually exclusive combinations of goods among which society must choose. • Opportunity cost … When there is efficiency in production, the only way to have more of one good is to have less of another.
Another Production Possibilities Model • There are 600 units of labor, the only input. • Two outputs: food (F) and clothing (C). • Technology is fixed; each unit of labor is able to produce either af units of food or ac units of clothing
output produced per unit of laborClothing ac = 1.0 unit of clothing per unit of laborFood af = 0.5 units of food per unit of labor
output produced per unit of laborClothing ac = 1.0 unit of clothing per unit of laborFood af = 0.5 units of food per unit of labor Given 600 units of labor, the implied production possibilities are as follows: Food Clothing 0 600 100 400 200 200 300 0
C 600 500 400 300 200 100 50 100 150 200 250 300 F output produced per unit of laborClothing = 1.0 unit of clothing per unit of laborFood = 0.5 units of food per unit of labor Implied Production Possibilities Food Clothing 0 600 100 400 200 200 300 0
Figure 3.a C 1200 1000 800 600 m 400 n 200 300 100 200 400 500 600 F
Figure 3.b Labor increases from 600 to 1000 units. C 1200 1000 800 600 400 200 300 100 200 400 500 600 F
Figure 3.b Labor increases from 600 to 1000 units. C 1200 1000 800 600 400 200 300 100 200 400 500 600 F
Figure 3.c Clothing output per unit of labor increases from 1 to 2 units C 1200 1000 800 600 400 200 300 100 200 400 500 600 F
Figure 3.c Clothing output per unit of labor increases from 1 to 2 units C 1200 1000 800 600 400 200 300 100 200 400 500 600 F
Figure 3.c Clothing output per unit of labor increases from 1 to 2 units C 1200 1000 800 600 400 200 300 100 200 400 500 600 F
Figure 3.d The productivity of labor increases 100%, both with respect to the production of F and C C 1200 1000 800 600 400 200 300 100 200 400 500 600 F
Figure 3.d The productivity of labor increases 100%, both with respect to the production of F and C C 1200 1000 800 600 400 200 300 100 200 400 500 600 F