Slide Note
0 likes | 0 Views
Taxation and social protection systems play a crucial role in addressing poverty and inequality in Africa. This study examines the distributional impact of tax-benefit systems in six African countries using state-of-the-art microsimulation models developed under the SOUTHMOD project. The research focuses on assessing income distribution, poverty, and inequality to inform policy decisions and potential reforms.

E N D
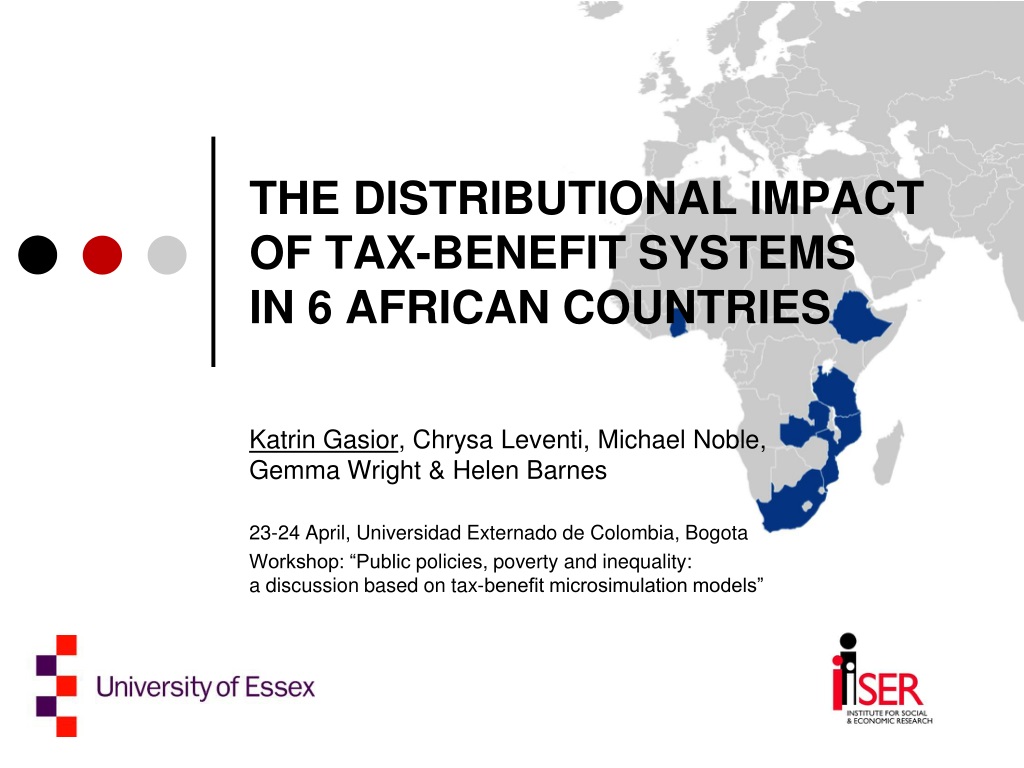
THE DISTRIBUTIONAL IMPACT OF TAX-BENEFIT SYSTEMS IN 6 AFRICAN COUNTRIES Katrin Gasior, Chrysa Leventi, Michael Noble, Gemma Wright & Helen Barnes 23-24 April, Universidad Externado de Colombia, Bogota Workshop: “Public policies, poverty and inequality: a discussion based on tax-benefit microsimulation models”
Background Taxation and social protection systems are emerging as crucial policy instruments to governments for pursuing distributional goals In Africa, only 18% of the population is covered by at least one social protection benefit, compared with 45% globally (ILO 2017). A growing number of African countries aim at improving effectiveness of tax- benefit systems But informed policy decisions require: An assessment of the distributional impact of public policies and the effects of measures on inequality/poverty Ex-ante evaluation of reform ideas Estimates of the fiscal impact of public policies and potential reforms Researchers/policy makers in developed countries make use of tax- benefit microsimulation models but few developing countries have access to such tools.
Our contribution Extensive literature on the distributional impact of taxes and benefits but very few studies focus on lower and middle-income countries (LMICs) in Africa (Inchauste & Lustig, 2017, Younger at al., 2016 & 2017) Our focus is on poverty and inequality measured (mostly) in terms of income We use 6 state-of-the-art tax-benefit microsimulation models developed under the SOUTHMOD project We assess the distribution and composition of incomes and the effects of taxes and benefits on poverty and inequality for a common time point (tax-benefit rules as of 30 June 2015, 1 July 2015 for Tanzania) We attempt to shed light on the role of different income components and the extent of support available to different population sub-groups
SOUTHMOD tax-benefit microsimulation models Developed by: UNU-WIDER (funder), SASPRI), the EUROMOD team at the UEssex together with local country teams Based on EUROMOD, a widely used tax-benefit model for the EU Use of common platform and well-tested methodological approach Flexible and freely-available EUROMOD software as a shortcut to the process of building tax-benefit models Analysis based on models for: 3 Low-income sub-Saharan countries: Ethiopia, Mozambique, Tanzania 2 Lower-middle income countries: Ghana, Zambia 1 Upper-middle income country: South Africa Simulation of cash benefits, in-kind benefits (in some countries), SIC, direct taxes and indirect taxes Make use of country specific household surveys
Data & simulation challenges in brief Lack of comparative sub-population variables and consistent category definitions for available variables Identification of informal workers used proxies not strictly comparable across countries Consumption data not available for South Africa, available for Ethiopia but not sure about the quality Benefit non-take up or restricted roll-out Different data years Income uprating using CPI Paucity of external statistics for validation More details in: Barnes, H., Noble, M., Wright, G., Gasior, K., Leventi, C. (forthcoming) Improving the comparability of the SOUTHMOD tax-benefit microsimulation models. UNU-WIDER Technical Note.
Basic population characteristics ET 22 5 45% 55% 6% 17% 32% 3% 3% 4% 18% GH 25 4 39% 61% 7% 21% 32% 4% 4% 11% 25% MZ 21 5 49% 51% 5% 13% 32% 3% 3% 6% 9% SA 28 4 30% 70% 8% 37% 26% 2% 4% 25% 6% TZ 23 5 44% 56% 6% 18% 32% 3% 4% 6% 10% ZM 22 5 43% 57% 4% 21% 29% 3% 3% 7% 17% Average age Average household size Aged 0-14 Aged 15-59 Aged 60+ Single Married/partnership Separated/divorced Widowed % with earnings % with self-employment income Note: Marital status does not include observations below the age of 15.
WELFARE CONCEPTS AND INDICATORS
Poverty and inequality indicators Poverty head count indicators International Poverty Line: Int$1.90 PPP (World Bank) Lower Middle Income Class Poverty Line: Int$3.20 PPP (World Bank) Upper Middle Income Class Poverty Line: Int$5.50 PPP (World Bank) National poverty lines, where they exist (and can be constructed from the available micro-data). Gini coefficient to asses inequality effects Plus mean and median income/consumption and quintile shares (% of income possessed by the income group) All monetary results are presented in annual values in international dollars using the Purchasing Power Parity (PPP) conversion factor Per capita definition is applied as equivalence scale
Applied income concepts Employment income Self-employment (incl. farming) Other market incomes Incl. indirect taxes Consumption Original income + pension + all benefits + all benefits – SIC + Benefits (cash and in-kind) - Direct taxes - SIC Disposable income + all benefits – direct taxes Post-fiscal income - VAT
How is income concentrated? Quintile shares, mean, median based on disposable income ET GH MZ SA TZ ZM Poorest 20% 1% 1% 0% 2% 0% 0% 2ndquintile 2% 3% 0% 4% 1% 1% 3rdquintile 4% 7% 2% 9% 4% 5% 4thquintile 8% 14% 10% 19% 12% 14% Richest 20% 845 75% 88% 67% 83% 79% Median 265 1,666 52 3,056 249 284 Mean 1,225 4,928 594 7,429 1,315 1,246 Notes: Household-level results. Quintile groups are calculated by ranking households according to their disposable income and dividing them into five equal-sized groups.
Decomposition of income sources Notes: Vertical axis shows % of disposable income. Horizontal axis shows population quintiles (based on disposable income).
Do taxes and benefits make a substantial contribution to reducing inequality? Gini coefficient using different income components and concepts ET 86.8 GH 73.1 MZ 85.3 SA 71.0 TZ 82.6 ZM 77.7 Orig. income Orig. income + pensions 86.8 73.1 85.2 68.5 82.6 77.7 Orig. income + pensions + benefits 86.6 73.1 84.6 65.7 82.2 76.8 Orig. income + pensions + benefits - SIC 86.6 73.1 84.5 65.7 82.1 76.5 Orig. income + pensions + benefits - taxes 83.1 72.6 85.0 63.0 80.5 76.2 Disposable income 83.2 72.6 84.8 63.0 80.4 75.9 Post-fiscal income 85.4 73.2 85.8 63.9 83.0 76.3 Consumption based . 41.8 52.4 . 38.9 59.0 Consumption (WDI) (39.1) (42.4) (54.0) (63.0) (37.8) (57.1) Notes: Household-level results, in per capita terms. Consumption (WDI) retrieved from World Bank website.
Does the poverty definition matter? Poverty rates using different poverty thresholds and income concepts ET 85.3 92.3 96.2 86.6 92.8 96.5 . . . . . (23.5) GH 31.1 44.9 60.6 32.3 46.4 61.6 9.2 27.2 54.4 38.7 24.2 (24.2) MZ 84.1 90.8 95.4 85.7 91.8 95.9 54.7 79.8 92.3 40.9 40.9 (46.1) SA 12.9 28.9 46.6 15.6 31.5 49.4 . . . . . (55.5) TZ 73.7 82.3 89.8 75.9 84.0 90.6 35.0 69.6 89.2 46.2 29.9 (28.2) ZM 70.6 79.0 86.0 71.3 79.4 86.4 52.6 69.9 84.2 60.1 55.1 (54.4) Disp. income < $1.9/day Disp. income < $3.2/day Disp. income < $5.5/day Post-fiscal < $1.9/day Post-fiscal < $3.2/day Post-fiscal < $5.5/day Consumption < $1.9/day Consumption < $3.2/day Consumption < $5.5/day Consumption < nat. poverty Consump. (NES) < nat. pov. Consump. (WDI) < nat. pov. Note: NES refers to national equivalence scale. Results for consumption (WDI) refer to different years (2015 for Ethiopia, 2012 for Ghana, 2014 for Mozambique, 2014 for South Africa, 2011 for Tanzania, and 2015 for Zambia). WDI: results retrieved from World Bank website.
Do taxes and benefits make a substantial contribution to reducing poverty? Poverty rates based on Int$1.90/day poverty threshold using different income concepts ET 85.0 GH 30.7 MZ 83.2 SA 35.1 TZ 73.5 ZM 70.1 Orig. income Orig. income + pensions 84.9 30.7 82.8 27.9 73.5 70.1 Orig. income + pensions + benefits 84.9 30.6 82.6 12.9 73.4 70.0 Orig. income + pensions + benefits - SIC 84.9 30.7 82.8 12.9 73.4 70.1 Orig. income + pensions + benefits - taxes 85.1 31.0 83.9 12.9 73.7 70.5 Disposable income 85.3 31.1 84.1 12.9 73.7 70.6 Post-fiscal income 86.6 32.3 85.7 15.6 75.9 71.3 Note: All results are in per capita terms.
Poverty rates of sub-population groups Based on Int$1.90/day poverty threshold and disposable income ET 85.8 GH 31.3 MZ 84.5 SA 13.5 TZ 73.6 ZM 70.8 Gender Women Men 84.7 30.8 83.6 12.3 73.9 70.3 Selected age-groups 88.6 34.0 87.7 15.9 78.6 75.8 0‒14 60+ 86.6 34.1 86.2 1.9 72.0 76.4 Household size 1 person 57.0 21.0 77.0 10.4 48.2 45.9 2 person 69.7 23.5 79.2 7.7 58.1 57.6 3–4 person 80.7 28.2 82.1 9.6 67.2 64.6 5–6 person 84.9 29.5 84.0 12.1 74.1 67.6 7+ person 90.8 37.8 86.1 18.8 79.0 77.4 With earnings 45.7 11.5 39.0 2.9 26.4 12.1 With self-empl. income 84.6 20.9 77.6 4.4 70.8 61.3 Total 85.3 31.1 84.1 12.9 73.7 70.6 Note: All results are in per capita terms.
SUMMARY AND CONCLUSION
Summary/Conclusion With the exception of South Africa, poverty rates (using $1.9 per capita/day) are largely unaffected by the tax-benefit arrangements In contrast, income inequality is reduced by the tax- benefit system in each country, using disposable income. Income inequality is higher than in South Africa in all five comparator countries, whether one uses original income, disposable income or post-fiscal income
Summary/Conclusion The use of EUROMOD software as a common platform with common concepts and terminology enables cross- country analysis of tax-benefit arrangements More to be done to hone the comparability of the country models and to take into account compliance levels and take-up/roll-out of benefits More to be done to scrutinise the quality of the underpinning data SOUTHMOD tax-benefit microsimulation models provide a good basis for exploring – and potentially improving – the tax-benefit systems in these six African countries.
Thank You! In case of further suggestions and comments, please contact: k.gasior@essec.ac.uk Further information: Gasior, K., Leventi, C., Barnes, H., Noble, M., Wright, G. (2018) The Distributional Impact of Tax and Benefit Systems in Six African Countries. UNU-WIDER Working Paper 2018/155. Barnes, H., Noble, M., Wright, G., Gasior, K., Leventi, C. (forthcoming) Improving the comparability of the SOUTHMOD tax-benefit microsimulation models. UNU-WIDER Technical Note. EUROMOD: https://www.euromod.ac.uk/ SOUTHMOD: https://www.wider.unu.edu/project/southmod-simulating-tax-and- benefit-policies-development