Download
1 / 18
180 likes | 293 Views
The Trade Indicators Project (TIP). An OECD horizontal and international project for creating a web-based, interactive research tool . The basic philosophy. Globalisation analysis requires cross-disciplinary thinking and approaches A wealth of information needs to be Sighted Sorted

E N D
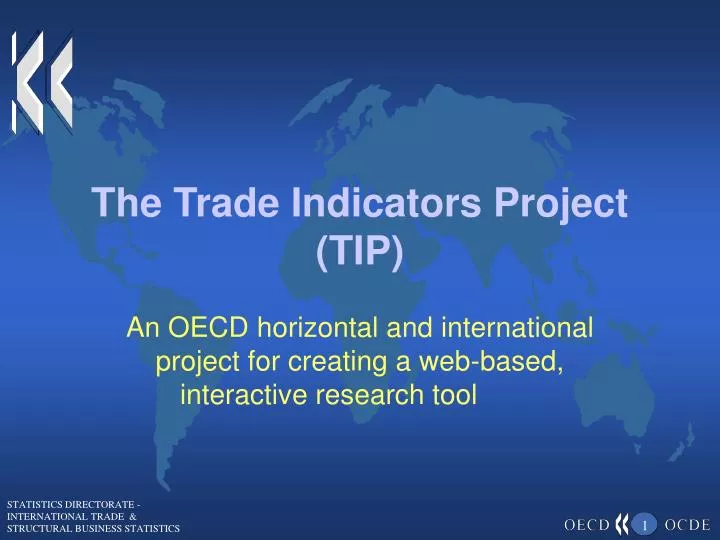
The Trade Indicators Project (TIP) An OECD horizontal and international project for creating a web-based, interactive research tool
The basic philosophy • Globalisation analysis requires cross-disciplinary thinking and approaches • A wealth of information needs to be • Sighted • Sorted • Analysed • Validated • Bring separate database together in one application without duplication
Progress made • There was strong agreement that there is growing demand for trade indicators and that the OECD should and could play a very useful role in this context. • A statistical project, such as the TIP, with a solid methodological underpinning, combining different data sources and which could help to further advance the research agenda was recognized as a major possible tool for the international research community. • OECDs richness of available international databases, ready to be used, was recognised as well as its competence and expertise in methodological questions • There was agreement that OECDs Roundtable approach should be continued and regularly reported to the Trade Experts meetings and other interested bodies. • There was a clear understanding that TIP would have to be embedded in the OECD.STAT environment. This means 2005 at the earliest from a data storage point of view. • The first Web-based pilot version has been realised and is in place at the time of writing (September 2005).
Progress made • As reported to the 4ht and 5th ITS meeting: • An inventory of available databases at OECD which could be used for the purposes of the TIP was drawn up by STD • A first tentative selection of possible indicators was drawn up by OECD • 3 Sources: an indicator “Taxonomy” (prepared by L. Iapadre, ICE) was integrated by OECD into the Roundtable conclusions and into the work done for the HEGI.
Achievements during the past 12 months: • A methodological standard framework (see next slide) was developed • Work for the OECD HEGI (“Aspects of trade globalisation Chapter”) served also as input into TIP • Thorough research was carried out compiling all eligible OECD data sources and data availability • Validation of data, integration into a Report Builder • Creation of an Interactive, Web-based query tool
OECD OCDE ORGANISATION DE COOPÉRATION ET DE DEVELOPMENT ÉCONOMIQUES TIP: Standard methodological framework ORGANISATION FOR ECONOMIC CO-OPERATION AND DEVELOPMENT & 12 - 14 (a.m.) September 2005 Beginning at 10.00 a.m. on the first day 13 (p.m.) – 15 September 2005 Beginning at 2:30 p.m. on the first day STATISTICS DIRECTORATE – INTERNATIONAL TRADE & STRUCTURAL BUSINESS STATISTICS 1
Trade indicator groups • Trade balance and coverage ratio • Trade openness • Trade performance indicators • Geographic concentration indicators • Specialisation • Foreign direct investment indicators • Foreign controlled affiliates indicators • Technology based indicators • Trade policy indicators (WTO) • Price Indicators • Trade intensity and specialisation indicators
1. Trade balance and coverage ratio • Trade balance value (X-M) • Normalised trade balance ( [X-M] / [X+M] ) • Coverage ratio (X/M) 2. Trade openness • Trade-to-GDP-ratio ( [X+M] / GDP ) • Export propensity ( X / GDP ) • Import penetration ration ( M / [GDP-X+M] ) • Trade per capita ([X+M] / POP ) • …
3. Trade performance indicators • Market shares ( xc / Xtotal ) • Export performance (Δxc –Σα* ΔMtotal ) • … 4. Geographic concentration indicators • Herfindahl index of geographical concentrationGeographical distribution of export market shares of goods • Geographical distribution of import penetration of goods • Services trading partners • ….
Database Database Database Database Database SNA/ANA ITCS ALFS TIS … OECD.stat flashmedia graphs Development of a TIP web tool Data extraction (SQL queries), data combination and calculation of the indicators, using XL Report Builder Creation of dot.stat format using a macro (Planned)
Access to the TIP data viaOECD.Stat Browser(planned) Save in xls-Format And/or save query
Interactive graphic presentation (planned) • The trade indicators will be probably made available as macromedia flash objects (*.swf) [embedded in *.html] • This will allow interactivity in the graphics • The graphs will be produced using “XCelsius” graphic software …examples…
Examples of interactive graphs 1 • Trade balance vs. normalised TB • Trade per capita, trade per capita to propensity • Export performance • Export/import propensity • Trade balance to GDP • Market shares • Geographical origin of import penetration 2 3 4 5 6 7 8 9
Directions for further research • Trade “plus” indicators, that is trade plus production (e.g. trade orientation measures), trade plus employment (e.g. correlation of trade and employment indicators, trade plus FDI/trade by foreign-affiliated firms (e.g. globalisation strategies). • More Trade in Services data is needed containing cross tabulations by products and partner countries. • Better integration of databases and Analytical Nomenclatures, e.g. by technology and factor intensity. • Links of customs sources with enterprise structural statistics, as discussed at the 6th ITS meeting to allow building up micro data on enterprise-characteristics, performance and related trade. • Trade intensity and specialisation indicators.


![Tour Into the Picture [TIP]](https://cdn2.slideserve.com/4157020/tour-into-the-picture-tip-dt.jpg)