Download
1 / 19
190 likes | 428 Views
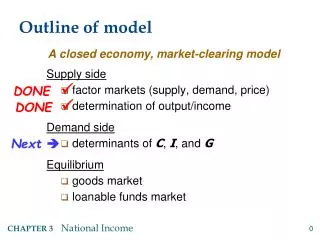
The Fixed-Price Keynesian Model : An Economy Below Full – Employment Focus on the Demand Side. Aggregate Expenditures = AE = GDP. Y = AE = C + I + G + NX Consumption expenditures (C) ≈ 68% of GDP Investment expenditures (I) ≈ 18% of GDP Government expenditures (G) ≈ 18% of GDP

E N D
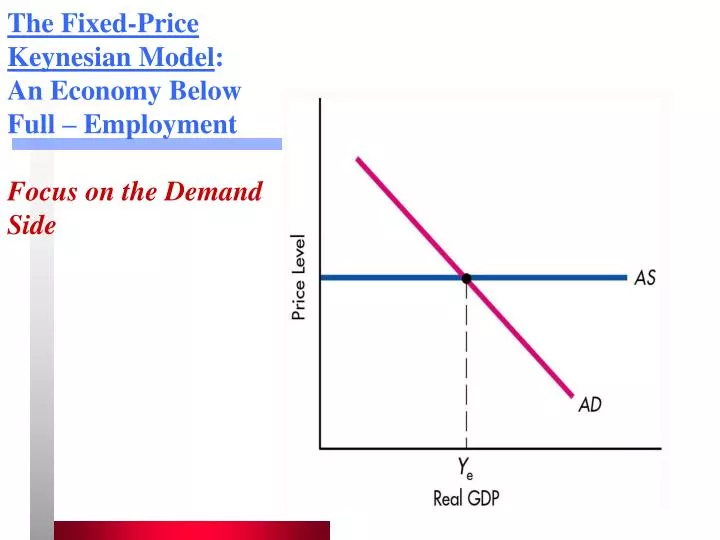
The Fixed-Price Keynesian Model: An Economy Below Full – EmploymentFocus on the Demand Side
Aggregate Expenditures = AE = GDP • Y = AE = C + I + G + NX • Consumption expenditures (C)≈ 68% of GDP • Investment expenditures (I)≈ 18% of GDP • Government expenditures (G)≈ 18% of GDP • Net exports (NX)≈ - 3 % of GDP Imports exceed exports by about 3% of GDP
Some Identities • Disposable income = Yd =Y-T, after tax income. Yd = Y - T = C + S • Keynes: people save a fixed proportion of their disposable income on average • Consumption is related to disposable income (Y-T). • C = Ca +cYd • Saving either finances private investment (I) or the government’s deficit (G – T) S = I + (G – T) at equilibrium • S + T = I + G • Leakages from the spending stream (S + T) = Injections to the spending stream (I + G)
Average Propensities to Consume and to Save • The average propensity to consume (APC): the proportion of disposable income spent for consumption APC = C/Yd • The average propensity to save (APS): proportion of disposable income saved APS = S/Yd APC + APS = 1 since Yd = C + S 1 = C/ Yd + S/ Yd
Consumption Function • C = Ca +cYd is a straight line with slope c. • Cais autonomous consumption. • The slope, c, is the marginal propensity to consume from disposable income (MPC). 0 < MPC < 1. • MPC is C/Yd, the amount by which consumption changes for each dollar change in Yd C C Ca Yd Yd MPC = C/Yd
Saving and Dissaving Planned C Yd (if C = Yd) Dissaving C > Yd C Saving Yd > C Yd Yd1 Yd* Yd2
Saving Function: When income increases, both consumption and saving increase • Since Y = C + S + T and Yd = Y – T • Yd = C + S • C = Ca + c Yd and • S = -Ca + (1-c) Yd • S = Sa + sYd [Sa = autonomous saving = - Ca] • S = Sa + mps x Yd ,where mps = s = marginal propensity to save • Note: mps + mpc = 1
Marginal Propensity to Consume: additional consumption in response to each additional dollar of disposable incomempc = ΔC/ΔYd
Shifts in the Consumption Function • Expected Future Income • An increase in expected future income will cause current consumption to rise and your saving to fall. • Wealth • An increase in wealth raises current consumption and lowers current saving. • Expected Real Interest Rate • Higher real return incentive to save more … but • Higher return to saving less needs to be put aside to achieve the same desired future savings. • Net effect: increased real interest rates reduce consumption and increase saving. • Demographics • Taxes – Ricardian Equivalence?
Investment Spending (I) • Capital goods have a long life. • Capital goods take time to build. • Capital goods involve large expenditure. • The present value of a capital good depends on the income it generates over a long time horizon. • Businesses must form expectations about future conditions and profitability. • Investment is inherently risky. • Investment expenditure tends to be erratic.
Determinants of Investment • Profit expectations • Interest rate • Technology • Price (Cost) of Capital Goods • Capacity Utilization • Profit expectations
Investment as a Function of Current IncomeInvestment depends more on expectations of the future than on what’s happening now.
Government Expenditures as a Function of Real GDPGovernment Expenditures are Largely Independent of the Current State of the Economy
Imports and Exports • The demand for imports depends on current economic activity, Y IM = IMa + imY • “im” is the marginal propensity to import (MPI). • Exports are exogenously determined • they don’t depend on conditions in our economy but rather on conditions in foreign economies • Net exports is NX = EX – (IMa + imY) orNX = (EX-IMa) – imY orNX = NXa – imY (a downward sloping line)