Download
1 / 1
20 likes | 187 Views
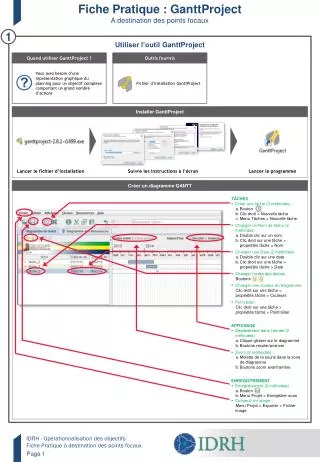
Fiche Pratique : GanttProject A destination des points focaux. 1. Utiliser l’outil GanttProject. Quand utiliser GanttProject ?. Outils fournis. Vous avez besoin d’une représentation graphique du planning pour un objectif complexe comportant un grand nombre d’actions.

E N D
Fiche Pratique : GanttProject A destination des points focaux 1 Utiliser l’outil GanttProject Quand utiliser GanttProject ? Outils fournis Vous avez besoin d’une représentation graphique du planning pour un objectif complexe comportant un grand nombre d’actions Fichier d’installation GanttProject Installer GanttProject Lancer le fichier d’installation Suivre les instructions à l’écran Lancer le programme Créer un diagramme GANTT • TÂCHES • Créer une tâche (3 méthodes) : • Bouton • Clic droit > Nouvelle tâche • Menu Tâches > Nouvelle tâche • Changer un Nom de tâche (2 méthodes) : • Double clic sur un nom • Clic droit sur une tâche > propriétés tâche > Nom • Changer une Date (2 méthodes) : • Double clic sur une date • Clic droit sur une tâche > propriétés tâche > Date • Changer l’ordre des tâches • Boutons • Changer une couleur du diagramme • Clic droit sur une tâche > propriétés tâche > Couleurs • Point bilan • Clic droit sur une tâche > propriétés tâche > Point bilan • AFFICHAGE • Déplacement dans l’année (2 méthodes) : • Cliquer-glisser sur le diagramme • Boutons reculer/avancer • Zoom (2 méthodes) : • Molette de la souris dans la zone de diagramme • Boutons zoom avant/arrière • ENREGISTREMENT • Enregistrement (2 méthodes) : • Bouton • Menu Projet > Enregistrer sous • Convertir en image : • Menu Projet > Exporter > Fichier image