Download
1 / 68
680 likes | 815 Views
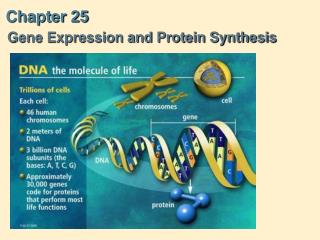
Chapter 25. Phylogeny and Systematics. Overview: Investigating the Tree of Life This chapter describes how biologists trace phylogeny The evolutionary history of a species or group of related species. Biologists draw on the fossil record Which provides information about ancient organisms.

E N D
Chapter 25 Phylogeny and Systematics
Overview: Investigating the Tree of Life • This chapter describes how biologists trace phylogeny • The evolutionary history of a species or group of related species
Biologists draw on the fossil record • Which provides information about ancient organisms Figure 25.1
Biologists also use systematics • As an analytical approach to understanding the diversity and relationships of organisms, both present-day and extinct
Currently, systematists use • Morphological, biochemical, and molecular comparisons to infer evolutionary relationships Figure 25.2
Concept 25.1: Phylogenies are based on common ancestries inferred from fossil, morphological, and molecular evidence
1 Rivers carry sediment to the ocean. Sedimentary rock layers containing fossils form on the ocean floor. 2 Over time, new strata are deposited, containing fossils from each time period. 3 As sea levels change and the seafloor is pushed upward, sedimentary rocks are exposed. Erosion reveals strata and fossils. Younger stratum with more recent fossils Older stratum with older fossils The Fossil Record • Sedimentary rocks • Are the richest source of fossils • Are deposited into layers called strata Figure 25.3
(c) Leaf fossil, about 40 million years old (b) Petrified tree in Arizona, about 190 million years old (a) Dinosaur bones being excavated from sandstone (d) Casts of ammonites, about 375 million years old (f) Insects preserved whole in amber (e) Boy standing in a 150-million-year-old dinosaur track in Colorado (g) Tusks of a 23,000-year-old mammoth, frozen whole in Siberian ice Figure 25.4a–g • Though sedimentary fossils are the most common • Paleontologists study a wide variety of fossils
Index fossils • Are similar fossils found in the same strata in different locations • Allow strata at one location to be correlated with strata at another location Figure 26.6
Accumulating “daughter” isotope 1 2 Ratio of parent isotope to daughter isotope 1 4 Remaining “parent” isotope 1 8 1 16 1 2 3 4 Time (half-lives) • The absolute ages of fossils • Can be determined by radiometric dating Figure 26.7
Ceno-zoic Meso-zoic Paleozoic Humans Land plants Origin of solar system and Earth Animals 4 1 Proterozoic Eon Archaean Eon Billions of years ago 2 3 Multicellular eukaryotes Single-celled eukaryotes Prokaryotes Figure 26.10 Atmospheric oxygen • The analogy of a clock • Can be used to place major events in the Earth’s history in the context of the geological record
The fossil record • Is based on the sequence in which fossils have accumulated in such strata • Fossils reveal • Ancestral characteristics that may have been lost over time
The magnetism of rocks • Can also provide dating information • Magnetic reversals of the north and south magnetic poles • Have occurred repeatedly in the past • Leave their record on rocks throughout the world
Mass Extinctions • The fossil record chronicles a number of occasions • When global environmental changes were so rapid and disruptive that a majority of species were swept away Millions of years ago 600 400 300 200 500 100 0 2,500 100 Number of taxonomic families 80 2,000 Permian mass extinction Extinction rate 60 1,500 Extinction rate ( ) Number of families ( ) 40 1,000 Cretaceous mass extinction 500 20 0 0 Carboniferous Neogene Cretaceous Ordovician Paleogene Devonian Cambrian Permian Jurassic Silurian Proterozoic eon Triassic Ceno- zoic Figure 26.8 Paleozoic Mesozoic
Morphological and Molecular Homologies • In addition to fossil organisms • Phylogenetic history can be inferred from certain morphological and molecular similarities among living organisms • In general, organisms that share very similar morphologies or similar DNA sequences • Are likely to be more closely related than organisms with vastly different structures or sequences
Sorting Homology from Analogy • A potential misconception in constructing a phylogeny • Is similarity due to convergent evolution, called analogy, rather than shared ancestry
Geological events that alter environments • Change the course of biological evolution • Conversely, life changes the planet that it inhabits Figure 26.1
NORTH AMERICA Chicxulub crater Yucatán Peninsula • The Cretaceous extinction • Doomed many marine and terrestrial organisms, most notably the dinosaurs • Is thought to have been caused by the impact of a large meteor Figure 26.9
Much remains to be learned about the causes of mass extinctions • But it is clear that they provided life with unparalleled opportunities for adaptive radiations into newly vacated ecological niches
Continental Drift • Earth’s continents are not fixed • They drift across our planet’s surface on great plates of crust that float on the hot underlying mantle
Eurasian Plate North American Plate Juan de Fuca Plate Caribbean Plate Philippine Plate Arabian Plate Indian Plate Cocos Plate South American Plate Pacific Plate Nazca Plate African Plate Australian Plate Scotia Plate Antarctic Plate Figure 26.18 • Often, these plates slide along the boundary of other plates • Pulling apart or pushing against each other
Volcanoes and volcanic islands Oceanic ridge Trench Subduction zone Oceanic crust Seafloor spreading Figure 26.19 • Many important geological processes • Occur at plate boundaries or at weak points in the plates themselves
India collided with Eurasia just 10 million years ago, forming the Himalayas, the tallest and youngest of Earth’s major mountain ranges. The continents continue to drift. 0 Cenozoic North America Eurasia By the end of the Mesozoic, Laurasia and Gondwana separated into the present-day continents. 65.5 Africa India South America Madagascar Australia Antarctica By the mid-Mesozoic, Pangaea split into northern (Laurasia) and southern (Gondwana) landmasses. Laurasia Millions of years ago 135 Gondwana Mesozoic At the end of the Paleozoic, all of Earth’s landmasses were joined in the supercontinent Pangaea. 251 Pangaea Paleozoic Figure 26.20 • The formation of the supercontinent Pangaea during the late Paleozoic era • And its breakup during the Mesozoic era explain many biogeographic puzzles
C. Fossil record is substantial, but incomplete • Ancestral characteristics may have been lost over time • D. Phylogeny has a biogeographic basis in continental drift: similar species should be found in close proximity, but our continents are moving. • E. History of life is punctuated by mass extinctions: catastrophic
#6Two major mass extinctions, the Permian and the Cretaceous: thus marking separtion in major eras of geologic time. • Have received the most attention • The Permian extinction • Claimed about 96% of marine animal species and 8 out of 27 orders of insects • Is thought to have been caused by enormous volcanic eruptions
Convergent evolution occurs when similar environmental pressures and natural selection • Produce similar (analogous) adaptations in organisms from different evolutionary lineages Figure 25.5
Analogous structures or molecular sequences that evolved independently • Are also called homoplasies
1 Ancestral homologous DNA segments are identical as species 1 and species 2 begin to diverge from their common ancestor. C C A T C A G A G T C C 1 C C A T C A G A G T C C 2 A C G G A T A G T C C A C T A G G C A C T A T C A C C G A C A G G T C T T T G A C T A G Deletion 2 Deletion and insertion mutations shift what had been matching sequences in the two species. 1 C C A T C A G A G T C C Figure 25.7 C C A T C A G A G T C C 2 Insertion G T A 3 Homologous regions (yellow) do not all align because of these mutations. C C A T C A A G T C C 1 C C A T G T A C A G A G T C C 2 4 Homologous regions realign after a computer program adds gaps in sequence 1. C C A T C A A G T C C 1 Figure 25.6 C C A T G T A C A G A G T C C 2 Evaluating Molecular Homologies • Systematists use computer programs and mathematical tools • When analyzing comparable DNA segments from different organisms
Concept 25.2: Phylogenetic systematics connects classification with evolutionary history • Taxonomy • Is the ordered division of organisms into categories based on a set of characteristics used to assess similarities and differences
Binomial Nomenclature • Binomial nomenclature • 8.a. Is the two-part format of the scientific name of an organism • Was developed by Carolus Linnaeus • 8.b. Organized into a hierarchical classification: broader and broader groups
The binomial name of an organism or scientific epithet • Is latinized • Is the genus and species
Panthera pardus Species Panthera Genus Felidae Family Carnivora Order Mammalia Class Chordata Phylum Animalia Kingdom Eukarya Domain Hierarchical Classification • Linnaeus also introduced a system • For grouping species in increasingly broad categories Figure 25.8
#9 Modern technique for grouping • Concept 25.4: Much of an organism’s evolutionary history is documented in its genome • Comparing nucleic acids or other molecules to infer relatedness • Is a valuable tool for tracing organisms’ evolutionary history
Panthera pardus(leopard) Mephitis mephitis (striped skunk) Canis familiaris (domestic dog) Canislupus (wolf) Lutra lutra (European otter) Species Genus Panthera Lutra Canis Mephitis Family Felidae Mustelidae Canidae Carnivora Order Linking Classification and Phylogeny • Systematists depict evolutionary relationships • In branching phylogenetic trees Figure 25.9
Leopard Domestic cat Common ancestor • Each branch point • Represents the divergence of two species
Wolf Leopard Domestic cat Common ancestor • “Deeper” branch points • Represent progressively greater amounts of divergence
Concept 25.3: Phylogenetic systematics informs the construction of phylogenetic trees based on shared characteristics • A cladogram • Is a depiction of patterns of shared characteristics among taxa • A clade within a cladogram • Is defined as a group of species that includes an ancestral species and all its descendants • Cladistics • Is the study of resemblances among clades
Cladistics • Clades • Can be nested within larger clades, but not all groupings or organisms qualify as clades
Grouping 1 E J K D H G F C I B A (a)Monophyletic. In this tree, grouping 1, consisting of the seven species B–H, is a monophyletic group, or clade. A mono-phyletic group is made up of an ancestral species (species B in this case) and all of its descendant species. Only monophyletic groups qualify as legitimate taxa derived from cladistics. • A valid clade is monophyletic • Signifying that it consists of the ancestor species and all its descendants Figure 25.10a
Grouping 2 G J K H E D C I F B A (b)Paraphyletic. Grouping 2 does not meet the cladistic criterion: It is paraphyletic, which means that it consists of an ancestor (A in this case) and some, but not all, of that ancestor’s descendants. (Grouping 2 includes the descendants I, J, and K, but excludes B–H, which also descended from A.) • A paraphyletic clade • Is a grouping that consists of an ancestral species and some, but not all, of the descendants Figure 25.10b
D E J G H K I F C B A (c)Polyphyletic. Grouping 3 also fails the cladistic test. It is polyphyletic, which means that it lacks the common ancestor of (A) the species in the group. Further-more, a valid taxon that includes the extant species G, H, J, and K would necessarily also contain D and E, which are also descended from A. • A polyphyletic grouping • Includes numerous types of organisms that lack a common ancestor Grouping 3 Figure 25.10c
Phylogenetic Trees and Timing • Any chronology represented by the branching pattern of a phylogenetic tree • Is relative rather than absolute in terms of representing the timing of divergences • 10. Therefore, a phylogenetic tree shows evolutionary relationships.
Shared Primitive and Shared Derived Characteristics • In cladistic analysis • #12.Clades are defined by their evolutionary novelties AND therefore what is considered a shared characterisitic.
Molecular Clocks • The molecular clock • Is a yardstick for measuring the absolute time of evolutionary change based on the observation that some genes and other regions of genomes appear to evolve at constant rates • 13: so they help track evolutionary time
A shared primitive character • Is a homologous structure that predates the branching of a particular clade from other members of that clade • Is shared beyond the taxon we are trying to define
A shared derived character • Is an evolutionary novelty unique to a particular clade
Outgroups • Systematists use a method called outgroup comparison • To differentiate between shared derived and shared primitive characteristics
As a basis of comparison we need to designate an outgroup • which is a species or group of species that is closely related to the ingroup, the various species we are studying • Outgroup comparison • Is based on the assumption that homologies present in both the outgroup and ingroup must be primitive characters that predate the divergence of both groups from a common ancestor
TAXA Lancelet(outgroup) Salamander Leopard Lamprey Turtle Tuna 0 0 0 Hair 0 0 1 CHARACTERS 0 0 0 0 1 1 Amniotic (shelled) egg 0 0 0 1 1 1 Four walking legs 0 0 1 1 1 1 Hinged jaws (a) Character table. A 0 indicates that a character is absent; a 1 indicates that a character is present. 0 1 1 1 1 1 Vertebral column (backbone) Leopard Turtle Hair Salamander Amniotic egg Tuna Four walking legs Lamprey Hinged jaws Lancelet (outgroup) (b) Cladogram. Analyzing the distribution of these derived characters can provide insight into vertebrate phylogeny. Vertebral column • The outgroup comparison • Enables us to focus on just those characters that were derived at the various branch points in the evolution of a clade Figure 25.11a, b