Download
1 / 34
360 likes | 496 Views
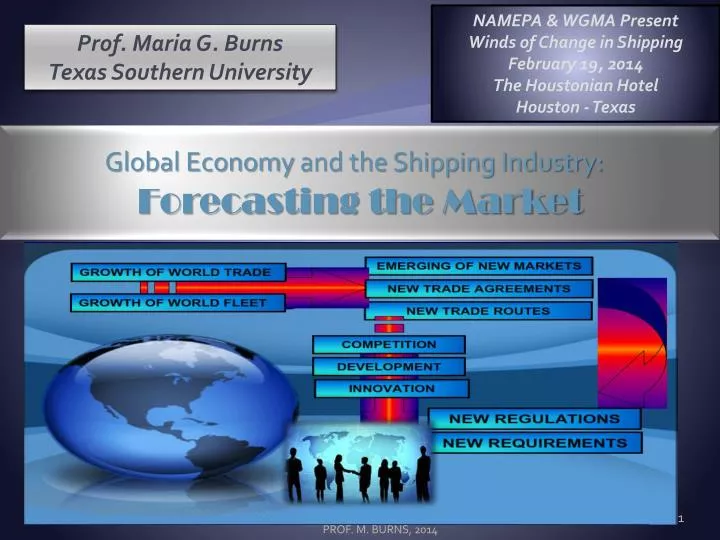
NAMEPA & WGMA Present Winds of Change in Shipping February 19, 2014 The Houstonian Hotel Houston - T exas. Prof. Maria G. Burns Texas Southern University. Global Economy and the Shipping Industry: Forecasting the Market. 2014 FORECAST!. THE MANY FACES OF THE TRIPLE-E Concept.

E N D
NAMEPA & WGMA Present Winds of Change in Shipping February 19, 2014 The Houstonian Hotel Houston - Texas Prof. Maria G. Burns Texas Southern University Global Economy and the Shipping Industry: Forecasting the Market PROF. M. BURNS, 2014
2014 FORECAST! MGB 2014
THE MANY FACES OF THE TRIPLE-E Concept MGB 2014
Global Economy and the Shipping Industry: Forecasting the Market Market Trends & Key Players Governments & Policy Makers • THE SHIPPING INDUSTRY: • New Ship Designs • New Environmental Regulations • Focus on the Triple-E Concept • LNG as Fuel • Oil Price Fluctuations • Shipbuilding Subsidies • AT A GLOBAL LEVEL: • Trade Deficit • Inflation, • Currency Manipulation • Escalating Geopolitical Tensions Classification Societies Port Authorities Ship Builders Shipowners Cargo Owners Financing & Investment PROF. M. BURNS, 2014
2014 FORECAST ! THE KEY DRIVERS OF THE MARITIME INDUSTRY ECONOMIES OF SCALE INNOVATION ENERGY SUPPLY & DEMAND SOURCE: M. BURNS - PORT MANAGEMENT AND OPERATIONS.*. CRC , 2014. MGB 2014
FORECASTING THE SHIPPING MARKET Source: M.BURNS - PORT MANAGEMENT AND OPERATIONS.*. CRC Press, Taylor & Francis Group
Forecasting the Market MGB 2014
GLOBAL GROWTH RATES 2010 2011 2012 2010 2011 2012 GDP Composition MGB 2014 2010 2011 2012
GDP (PPP) • per Capita GLOBAL GROWTH ADVANCED VS. DEVELOPING COUNTRIES MGB 2014
GDP (PPP) SOURCE: M. BURNS - PORT MANAGEMENT AND OPERATIONS.*. CRC Press, Taylor & Francis Group based on data from US Bureau Of Economic Analysis. 1980-2013,and China NBS, 2013.
Figure : World’s leading Ports by Hemisphere, 2003-2013 : AUSTRALASIA VS. THE AMERICAS, EUROPE & AFRICA MGB 2014
World’s leading Ports MGB 2014
Global sources of pollution. MB, NAMEPA 2014
World’s leading Ports World’s marine pollution World’s natural seeps World’s leading Economies MGB 2014
ECONOMY Vs. ECOLOGY While the sources of anthropogenic (man-made) pollution receive considerable publicity, little is known of the naturally spilled oil and gas that the seas have been receiving and absorbing for 400 million years. Source: compiled by M. Burns, based on data from Bureau of Ocean Energy Management, 2009 (www.boem.gov) and National Research Council, “Oil in the Sea” 2003 (www.nap.gov) MB, NAMEPA 2014
#Global Offshore Natural Seeps Seepage and their association with Earthquakes 2007 2013 MB, NAMEPA 2014
COMPLIANCE TO ENVIRONMENTAL REGULATIONS MB, DOT 2013
Forecasting the Market Global Areas of Growth MGB 2014 GDP, Technology, Population
Forecasting the Market National Areas of Growth MGB 2014
#ENVIRONMENTAL POLLUTION BY STATE MB, DOT 2013
Table : World seaborne trade in 2006–2012, by type of cargo. (Millions of tons) 2006 2007 2008 2009 2010 2011 2012 MGB 2014
Table : World seaborne trade in 2006–2012, by type of cargo. (Millions of tons) 2006 2007 2008 2009 2010 2011 2012 CARGO LOADED CARGO UNLOADED 06 07 08 09 10 11 12 06 07 08 09 10 11 12 MGB 2014 SOURCE: M. BURNS - PORT MANAGEMENT AND OPERATIONS.*. CRC Press, Taylor & Francis Group based on data from UNCTAD Statistics, 1980 - 2013
Table : World seaborne trade in 2006–2012, by type of cargo. (Millions of tons) 2006 2007 2008 2009 2010 2011 2012 GLOBAL FLEET CARGO UNLOADED 80 81 82 83 84 85 86 87 88 89 90 91 92 93 94 95 96 97 98 99 00 01 02 03 04 05 06 07 08 09 10 11 12 13 06 07 08 09 10 11 12 SOURCE: M. BURNS - PORT MANAGEMENT AND OPERATIONS.*. CRC Press, Taylor & Francis Group based on data from UNCTAD Statistics, 1980 - 2013 MGB 2014
World Commodities carried by sea, • Fleet by key ship types (millions of DWT) PORT MANAGEMENT AND OPERATIONS.* M. BURNS . CRC Press, Taylor & Francis Group
FORECASTIN G THE MARKET VIA COMMODITIES ECONOMIC IMPACT ECONOMY Drilling rig activity 85-86-87-88-89-90-91-92-93-94-95-96-97-98-99-00-01-02-03-04-05-06-07-08-09-10-11-12 Compiled based on www.data.bsee.gov, 2013 MB, NAMEPA 2014
COMMODITY MARKETS Source: M.BURNS - PORT MANAGEMENT AND OPERATIONS.*. CRC Press, Taylor & Francis Group
COMMODITY MARKETS Source: M.BURNS - PORT MANAGEMENT AND OPERATIONS.*. CRC Press, Taylor & Francis Group
COMMODITY MARKETS Source: M.BURNS - PORT MANAGEMENT AND OPERATIONS.*. CRC Press, Taylor & Francis Group
COMMODITY MARKETS Source: M.BURNS - PORT MANAGEMENT AND OPERATIONS.*. CRC Press, Taylor & Francis Group
ENERGY MARKETS MGB 2014
ENERGY MARKETS Source: M.BURNS - PORT MANAGEMENT AND OPERATIONS.*. CRC Press, Taylor & Francis Group
Global Economy and the Shipping Industry: Forecasting the Market MGB 2014
Prof. Maria G. Burns Faculty - Certified Maritime Auditor (HSQE) TEXAS SOUTHERN UNIVERSITY Houston - TX 77004 Office Tel: 713-313-6784 Cell : 832-663-2746 E-mail: burnsm@tsu.edu PROF. M. BURNS, 2014