Download
1 / 9
90 likes | 180 Views
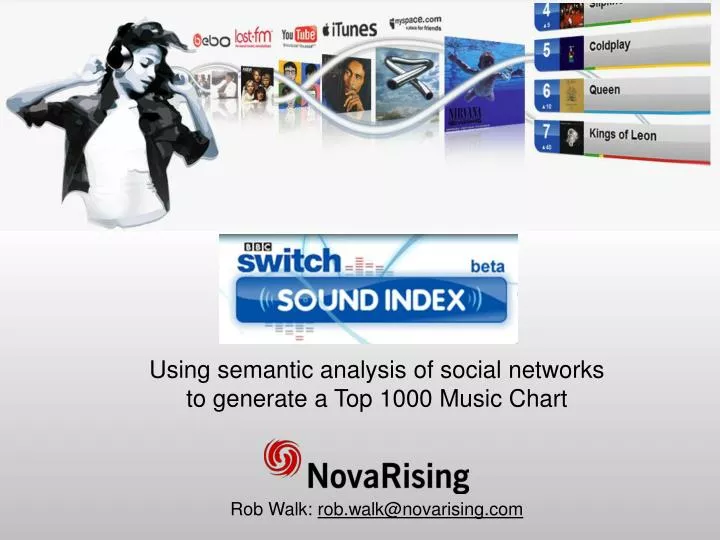
Using semantic analysis of social networks to generate a Top 1000 Music Chart. Rob Walk: rob.walk@novarising.com. Sound Index: Switch – BBC’s teen brand & TV music show Sound Index crawls social media sites to generate a top 1000 music chart Aggregating user comments, play counts & downloads

E N D
Using semantic analysis of social networks to generate a Top 1000 Music Chart Rob Walk: rob.walk@novarising.com
Sound Index: • Switch – BBC’s teen brand & TV music show • Sound Index crawls social media sites to generate a top 1000 music chart • Aggregating user comments, play counts & downloads • Crawl completed every 48 hours - ~25m data points • Data published every 4-6 hours
Sound Index: • Analysing data from: • Semantic analysis used to identify tracks & user sentiment to track • Semantics “Sick Ollie” test • Referenced against Music Brainz Taxonomy (Last FM) • Algorithm developed to rank & normalise data
My Index: • Dynamic, real-time personalised chart • Users could select genre, demographics and data sources to create their own index instantly • User demographics taken from social sites & appended to each music data point • New real-time OLAP engine created to cope with modelling massive data volumes online
Mashed-up UX: • Dynamic front-end, provided engagement layer including: • Video of the track • History of Artist • Artist’s discography • Charting of track success • Comparison with other tracks • All re-built on the fly every 6 hours as chart updates
Challenges: • Noise vs Freshness – Respond to genuine trends without overly reporting short-term spikes • Spam & off-topic detection – How do you prevent the Index from being manipulated? How do you keep it relevant? • Business intelligence – How do you enable real-time customisation of such a large volume of data? • Taste and decency – How do you get rid of offensive content? How do you keep it when it is genuine? The Sex Pistols, for example.
Results – A success: • Without any marketing the Sound Index went from a standing start in April to deliver 43,469 visits from 37,900 users in June • In that month, there were 140,383 page views at an average of 3.67 per user • Each user spent an average time of 3 minutes 40 seconds on the site • In August, there were over 772,000 web page references to the Sound Index
Next steps: • Adding new feeds (Twitter & Facebook) • Leveraging others’ investment in real-time crawling • Editorial over Taxonomy ( e.g. Joe McElderry – The Climb) • Splitting of UK & US data (YouTube in particular) • Dynamic algorithms for users to select & weight sources • Application of technology to gauge buzz around : • movies, books, games, leaders politicians, presenters, sports personalities, celebrities, stocks, companies, etc.....
The Sound Index demo can be found at http://bbcindex.novarising.com Rob Walk: rob.walk@novarising.com