Download
1 / 21
210 likes | 332 Views
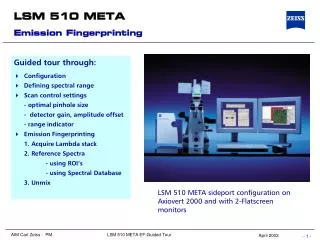
Emission Fingerprinting. Guided tour through: Configuration Defining spectral range Scan control settings - optimal pinhole size - detector gain, amplitude offset - range indicator Emission Fingerprinting 1. Acquire Lambda stack 2. Reference Spectra - using ROI’s

E N D
Emission Fingerprinting • Guided tour through: • Configuration • Defining spectral range • Scan control settings - optimal pinhole size - detector gain, amplitude offset - range indicator • Emission Fingerprinting 1. Acquire Lambda stack 2. Reference Spectra - using ROI’s - using Spectral Database 3. Unmix LSM 510 META sideport configuration on Axiovert 2000 and with 2-Flatscreen monitors
Emission Fingerprinting - the Method 1. Mode 2 - Lambda Mode 1. Acquire a Lambda Stack* 2. Select Reference Spectra 3. Perform Linear Unmixing and view the results *contains spectral information for each pixel 2. 3.
Getting started 1) start the software 2) Select Acquire • 4) Select Micro • choose objective lens from pulldown menu • select appropriate Filterset for fluorescence (e.g. FS01 for DAPI, FS09 for GFP) 5) switch to LSM mode • 3) Select Laser • switch on required Laser lines • Argon laser power should be 60 %
Configuration 1) select config and then Lambda Mode 2) Define spectral range for Lambda stack acquisition NOTE: for specimen protection --> keep number of passes low! 3) Select excitation laser lines and set transmission values 4) Select main dichroic beam splitter (HFT)
Scanning Parameters 3) enter scan speed and select Scan average (slower scan speed and averaging gives best signal/noise ratio) 1) Select Scan and Mode 2) Select Frame size as predefined number of pixels or enter your own values (e.g. 512x72) number of pixels influences scanning resolution 4) Select dynamic range 8 bit yields 256, 12 bit 4096 levels NOTE: Images for publication should be acquired using 12 bit and high number of pixels
I X Adjusting Pinhole 2) set pinhole size 1) Select Scan and Channels pinhole size=1 Airy unit 1 Airy units produces best signal/noise ratio Pinhole adjustment changes „optical slice“ (i.e.confocality) NOTE: Pinhole 1 controls all 32 META detector elements
Acqusition 1) Select Find to automatically pre-adjusts detector sensitivity 2) Select Fast XY for continous fast scanning (useful for finding and changing the focus) 3) Use Single or Cont to Start Acquisition...
Emission Fingerprinting- Lambda stack ... Lambda stack (22 elements, 3 passes) (Gallery Mode display)
Emission Fingerprinting- Range Indicator 1) Select Palette 2) Select Range Indicator Red = Saturation (Maximum) Blue = Zero (Minimum)
Emission Fingerprinting- Set Gain & Offset • Detector Gain determines sensitivity of the detector by setting the maximum limit • Ampl. Offset determines the minimum intensity limit • Ampl. Gain determines signal amplification Saturation at Maximum reduce Detector Gain Saturation at Minimum increase Ampl. Offset Gain Offset Gain set correctly Ampl. Gain increases whole signal, and the offset will need to be decreased Offset set correctly
Lambda coded display Gallery Mode Emission Fingerprinting - correct offset and gain • Increase offset until all blue pixels disappear • Reduce gain until red pixels only just disappear
Emission Fingerprinting - using ROI’s 1) Select Mean Mode 2) Define different Region’s of Interest (corresponding spectra are displayed in graph on the left) 3) click Linear Unmixing
Emission Fingerprinting - using ROI’s Clear separation, no overlap
Emission Fingerprinting - using Spectral DB If no clear spectral separation between different areas is possible, then reference spectra need to be obtained from individual controls 1) Acquire Lambda stack 2) In MeanROI Mode, draw Region of Interest 3) Save Spectra to Database
Emission Fingerprinting - using Spectral DB 4) select existing or create new folder 5) Assign appropriate name and enter comments (optional), then Save 6) Repeat steps 1) - 5) for all necessary individual controls (including Autofluorescence and background) IMPORTANT: All controls have to be obtained under the SAME CONDITIONS (i.e. same system, HFT, detector range and objective!!!) Otherwise unmixing will return false results!!! NOTE: Reference spectra will be normalized to the maximum intensity and can be displayed either as spline curve or raw data points (use right mouse button for switching)
Emission Fingerprinting - using Spectral DB 1) From Main Menu, select Process and the Unmix 3) select Lambda stack (Source) for unmixing, click Apply 2) Select individual previously saved reference spectra from folder, assign channel and color ...
GFP YFP overlay BG Emission Fingerprinting - using Spectral DB Original Lambda stack... ...separation into individual channels after unmixing
Linear Unmixing – How it works! Unmixing separates the total emission signal into weighted contributions of each dye based on the knowledge of their “emission fingerprints” – pixel by pixel! + = Combined spectra a x GFP b x YFP
Emission Fingerprinting • What is Emission Fingerprinting? • 3-step-method for (1) recording, (2) analysis and (3) separation of emission signals in multifluorescence imaging • Separation of individual emissions based on the recording of spectral signatures and a digital unmixing procedure using reference spectra • What is it good for? • Separation even of fluorochromes with widely overlapping emission spectra • Separation of fluorochromes that are excited by the same laser line (in single-photon and multiphoton microscopy) • Elimination of background- and autofluorescence • Lambda Stack recording and export of spectral data can be sufficient for some applications (environmental changes affect emission spectra
Emission Fingerprinting • Hints • Demo: start easy - do not push Emission Fingerprinting for all applications • Some applications do work well just with Lambda Stack acquisition and spectral evaluation • Use extract to channel to improve band pass imaging (Apply to Hardware) • Hint: overlapping bands will create Multitracking configuration) • Spectra database • use descriptive folder names • keep it clean • Use CFP and YFP filter cubes for system in case of FRET (YFP = FITC) • Use same configuration for controls and final experiment • HFT, laser lines (e. g. 458/514 will influence YFP spectra), objective • Use fingerprint to unmix reflections of laser lines
Emission Fingerprinting • Don’t’s • Do not saturate Lambda Stack channels • Do not change configuration for controls and final experiment • Do not use “library spectra”