CHAPTER 3 SECTION 3.4 CONCAVITY AND THE SECOND DERIVATIVE TEST
670 likes | 1.05k Views
CHAPTER 3 SECTION 3.4 CONCAVITY AND THE SECOND DERIVATIVE TEST. Definition of Concavity and Figure 3.24. Sketch 4 graphs a)1 decreasing and concave up b)1 increasing and concave up, c)1 decreasing and concave down, d)1 increasing and concave down. y. y. x. x. b. a. y. y. x. x. d. c.

CHAPTER 3 SECTION 3.4 CONCAVITY AND THE SECOND DERIVATIVE TEST
E N D
Presentation Transcript
CHAPTER 3SECTION 3.4CONCAVITY AND THE SECOND DERIVATIVE TEST
Sketch 4 graphs a)1 decreasing and concave upb)1 increasing and concave up, c)1 decreasing and concave down,d)1 increasing and concave down y y x x b a y y x x d c
Concave upward y y x x • Look at these two graphs. Each is concave upward, but one is decreasing and the other is increasing. We need to be able to determine concavity from the function and not just from the graph. For each of the graphs above sketch the tangent lines to the graph at a number of different points.
As we move from left to right the slopes of the tangent lines are getting less negative. That is they are increasing. Concave upward y x
As we move from left to right the slopes of the tangent lines are getting larger. That is they are increasing. Concave upward
When a graph is concave upward The slope of the tangent lines are increasing.
Concave downward y y x x • Look at these two graphs. Each is concave downward, but one is decreasing and the other is increasing. We need to be able to determine concavity from the function and not just from the graph. For each of the graphs above sketch the tangent lines to the graph at a number of different points.
As we move from left to right, the slopes of the tangent lines are getting more negative. They are decreasing. Concave downward
As we move from left to right the slopes of the tangent lines are getting smaller. That is they are decreasing. Concave downward
When a graph is concave downward The slopes of the tangent lines are decreasing.
Putting it all together • For a function f that is differentiable on an interval I, the graph of f is • (i) Concave up on I, if the slope of the tangent line is increasing on I or • (ii) Concave down on I, if the slope of the tangent line is decreasing on I
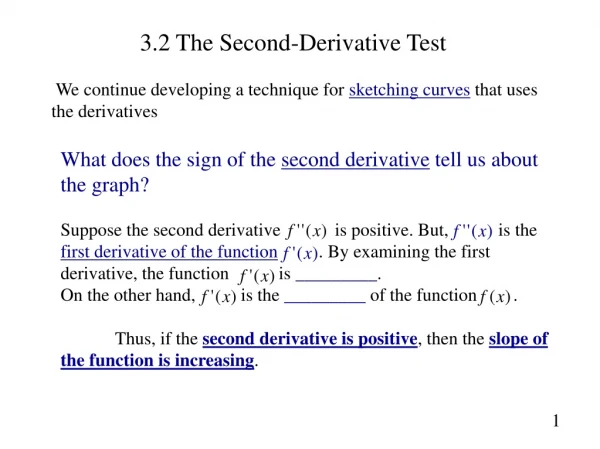
Linking knowledge • (i) Concave up on I, if the slope of the tangent line is increasing on I. • If the slope of the tangent line is increasing and the slope of the tangent line is represented by the first derivative and to determine when something is increasing we had to take the derivative, then to find where the slope of the tangent line (f ‘(x)) is increasing we will need to take the derivative of f ‘(x) or find the second derivative f “(x) I know, this is a very large run on sentence.
Linking knowledge • (ii) Concave down on I, if the slope of the tangent line is decreasing on I • If the slope of the tangent line is decreasing and the slope of the tangent line is represented by the first derivative and to determine when something is decreasing we had to take the derivative, then to find where the slope of the tangent line (f ‘(x)) is decreasing we will need to take the derivative of • f ‘(x) or find the second derivative f “(x)
Definition of concavity • For a function f that is differentiable on an interval I, the graph of f is • (i) Concave up on I, if f’ is increasing on I or • (ii) Concave down on I, if f’ is decreasing on I
Putting it all together • Given the function f(x) • f(x) = 0 x-intercepts • f(x) undefined vertical asymptote • f(x)>0 Q-1 or Q-2 • f(x)<0 Q-3 or Q-4
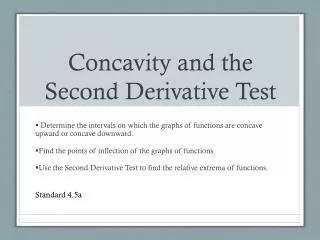
Determine the open intervals on which the graph is concave upward or concave downward. Concavity find second derivative. Find hypercritical numbers. Set up a chart Find concavity Determining concavity
A point of inflection for the graph of f is that point where the concavity changes. Points of inflection
Example 1: Graph the function f given by • and find the relative extrema. • 1st find graph the function.
Example 1 (continued): • 2nd solve f (x) = 0. • Thus, x = –3 and x = 1 are critical values.
Example 1 (continued): • 3rd use the Second Derivative Test with –3 and 1. • Lastly, find the values of f (x) at –3 and 1. • So, (–3, 14) is a relative maximum and (1, –18) is a • relative minimum.
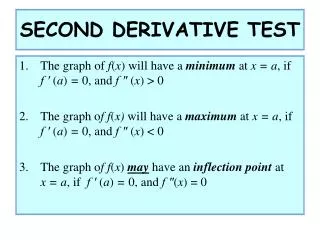
Second Derivative Test If c is a critical number of f’(x) and… a. If f’’(c) > 0 then ________________________ b. If f’’(c) < 0 then ________________________ c. If f’’(c) = 0 or undefined then __________________________________
Second Derivative Test If c is a critical number of f’(x) and… (c, f(c)) is a relative min a. If f’’(c) > 0 then ________________________ (c, f(c)) is a relative max b. If f’’(c) < 0 then ________________________ the test fails (use 1st Derivative test) c. If f’’(c) = 0 or undefined then __________________________________
Concave downward Concave upward Inflection Points If f’(x) = 0 ______________ If f’(x) < 0 ______________ If f’(x) > 0 ______________ If f’’(x) = 0 ______________ If f’’(x) < 0 ______________ If f’’(x) > 0 ______________ ______________ ________________ ______________ The second derivative gives the same information about the first derivative that the first derivative gives about the original function. For f(x) to increase, _____________ For f(x) to decrease, _____________ For f’(x) to increase, _____________ For f’(x) to decrease, _____________
Concave downward Concave upward Slopes decrease Slopes increase Inflection Points Where concavity changes Occur at critical numbers of f”(x) f(x) is constant f(x) decreases f(x) increases If f’(x) = 0 ______________ If f’(x) < 0 ______________ If f’(x) > 0 ______________ f’(x) is constant f’(x) increases f’(x) decreases If f’’(x) = 0 ______________ If f’’(x) < 0 ______________ If f’’(x) > 0 ______________ f(x) is conc up f(x) is a straight line f(x) is conc down ______________ ________________ ______________ The second derivative gives the same information about the first derivative that the first derivative gives about the original function. f’(x) > 0 For f(x) to increase, _____________ f’(x) < 0 For f(x) to decrease, _____________ f’’(x) > 0 f’’(x) < 0 For f’(x) to increase, _____________ For f’(x) to decrease, _____________
Include extrema, inflection points, and intervals of concavity. Sketch
No VA’s Include extrema, inflection points, and intervals of concavity. Critical numbers: None Sketch smooth Critical numbers: None
Crit numbers: 1. Find the extrema of 2nd Derivative Test rel max at rel min at rel max at rel min at
Crit numbers: 2. Sketch 2nd Derivative Test rel max at rel min at Crit numbers: Intervals: Test values: f ’’(test pt) f(x) Inf pt
2 2 -2
(3, 4) 3 Find a Function Describe the function at the point x=3 based on the following:
5 Find a Function Describe the function at the point x=5 based on the following:
2 Find a Function Given the function is continuous at the point x=2, sketch a graph based on the following: (2,3)