Download
1 / 22
220 likes | 291 Views
WHAT IS THE GREENHOUSE EFFECT ?. OR, WHAT THE HELL IS THIS UGLY GRAPH?. Oxygen & Ozone. 100% of radiation absorbed by gas. Oxygen & Ozone. 0% of radiation absorbed by gas. Shorter . Longer . Visible ( Insolation ). Oxygen & Ozone. 0.4 μ Violet. 0.7 μ Red. Shorter .

E N D
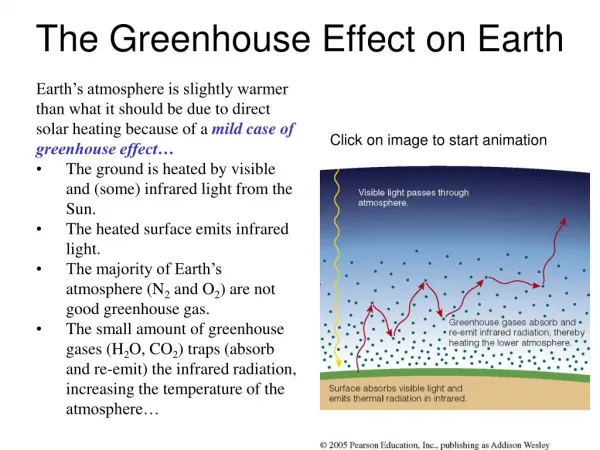
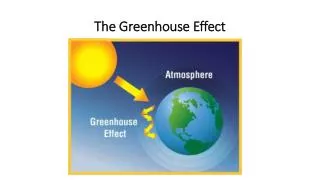
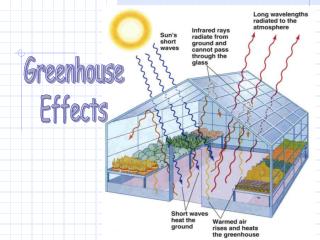
WHAT IS THE GREENHOUSE EFFECT ?
Oxygen & Ozone
100% of radiation absorbed by gas. Oxygen & Ozone 0% of radiation absorbed by gas.
Shorter Longer Visible (Insolation) Oxygen & Ozone 0.4 μ Violet 0.7 μ Red
Shorter Longer Visible (Insolation) Oxygen & Ozone Little or no absorption of visible light
Shorter Longer Visible (Insolation) High absorption of Ultra-violet light Oxygen & Ozone Little or no absorption of visible light
Shorter Longer Visible (Insolation) High absorption of Ultra-violet light Oxygen & Ozone Little or no absorption of visible light Atmosphere absorption of visible light is very low All Atmosphere
INPUT OUTPUT Shorter Longer Visible (Insolation) Outgoing Longwave Radiation
INPUT OUTPUT Shorter Longer Visible (Insolation) Outgoing Longwave Radiation Methane
Shorter Longer Visible (Insolation) Outgoing Longwave Radiation Nitrous Oxide
Shorter Longer Visible (Insolation) Outgoing Longwave Radiation Oxygen & Ozone
Shorter Longer Visible (Insolation) Outgoing Longwave Radiation Carbon Dioxide
Shorter Longer Visible (Insolation) Outgoing Longwave Radiation Water Vapor
Shorter Longer Visible (Insolation) Outgoing Longwave Radiation All Atmosphere
Contours of peak warming.Contours of peak CO2-induced warming (as given by Eq. 3 in the Box) as a function of the starting date of the GMS and the implemented reduction rate of emissions. 1.5°C WAIT UNTIL 2020 ELECTION 2°C 2.5°C 3°C 3.5°C 4°C T F Stocker, Science 2013;339:280-282 Published by AAAS
Contours of peak warming.Contours of peak CO2-induced warming (as given by Eq. 3 in the Box) as a function of the starting date of the GMS and the implemented reduction rate of emissions. WAIT UNTIL 2032 ELECTION 2°C 2.5°C 3°C 3.5°C 4.5°C 4°C T F Stocker Science 2013;339:280-282 Published by AAAS
Contours of peak warming.Contours of peak CO2-induced warming (as given by Eq. 3 in the Box) as a function of the starting date of the GMS and the implemented reduction rate of emissions. WAIT UNTIL 2040 ELECTION 2.5°C 3°C 3.5°C 5°C 4°C T F Stocker Science 2013;339:280-282 Published by AAAS
Contours of peak warming.Contours of peak CO2-induced warming (as given by Eq. 3 in the Box) as a function of the starting date of the GMS and the implemented reduction rate of emissions. WAIT UNTIL 2060 ELECTION 3.5°C 4°C 5°C T F Stocker Science 2013;339:280-282 Published by AAAS
Contours of peak warming.Contours of peak CO2-induced warming (as given by Eq. 3 in the Box) as a function of the starting date of the GMS and the implemented reduction rate of emissions. T F Stocker Science 2013;339:280-282 Published by AAAS