Download
1 / 1
10 likes | 140 Views
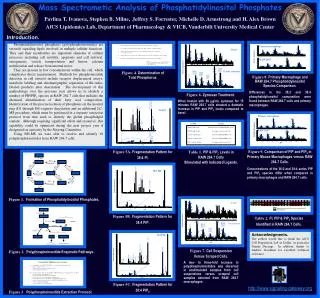
Mass Spectrometic Analysis of Phosphatidylinositol Phosphates Pavlina T. Ivanova, Stephen B. Milne, Jeffrey S. Forrester, Michelle D. Armstrong and H. Alex Brown AfCS Lipidomics Lab, Department of Pharmacology & VICB, Vanderbilt University Medical Center. Introduction.

E N D
Mass Spectrometic Analysis of Phosphatidylinositol Phosphates Pavlina T. Ivanova, Stephen B. Milne,Jeffrey S. Forrester,Michelle D. Armstrong and H. Alex Brown AfCS Lipidomics Lab, Department of Pharmacology & VICB, Vanderbilt University Medical Center Introduction. Phosphatidylinositol phosphates (polyphosphoinositides) are versatile signaling lipids involved in multiple cellular functions. They and their metabolites are important elements of cellular processes including cell motility, apoptosis and cell survival, oncogenesis, vesicle transportation and fusion, calcium mobilization and release from internal stores. They are present in low concentrations within the cell, which complicates direct measurement. Methods for phosphoinositide detection in cell extracts include receptor displacement assays, metabolic labeling and chromatographic separation of the radio-labeled products after deacylation. The development of this methodology over the previous year allows us to identify a number of PIP/PIP2 species in RAW 264.7 cells that includes the chemical identification of their fatty acyl composition. Identification of the precise location of phosphates on the inositol ring (D1 through D6) requires deacylation and an additional LC-MS procedure, which must be performed in a separate extraction protocol from that used to identify the global phospholipid content. Although requiring significant effort and resources, this capability could be optimized during the next project year if designated as a priority by the Steering Committee. Using ESI-MS we were able to resolve and identify 18 polyphosphoinositides from RAW 264.7 cells. Introduction: Figure 4. Determination of Total Phosphorus. Figure 8. Primary Macrophage and RAW 264.7 Phosphatidylinositol Species Comparison. Differences in the 36:2 and 38:4 phosphatidylinositol composition were found between RAW 264.7 cells and primary macrophages. Figure 6. Zymosan Treatment. When treated with 50 mg/mL zymosan for 15 minutes RAW 264.7 cells showed a dramatic increase in PIP and PIP2 levels compared to basal. Figure 9. Comparison of PIP and PIP2 in Primary Mouse Macrophages versus RAW 264.7 Cells. Concentrations of the 36:2 and 38:4 series PIP and PIP2 species differ when compared in primary macrophages and RAW 264.7 cells. Figure 5A. Fragmentation Pattern for 38:4 PI. Table 1. PIP & PIP2 Levels in RAW 264.7 Cells Stimulated with Indicated Ligands. Figure 1. Formation of Phosphatidylinositol Phosphates. Figure 5B. Fragmentation Pattern for 38:4 PIP. Table 2. PI, PIP & PIP2 Species Identified in RAW 264.7 Cells. Acknowledgments. The authors would like to thank the AfCS Cell Preparation Lab in Dallas, in particular Dianne Decamp. In addition, thanks to Andrew Goodman for excellent technical assistance. Figure 2. Polyphosphoinositide Enzymatic Pathways. Figure 7. Cell Suspension Versus Scraped Cells. A two- to three-fold increase in polyphosphoinositides was observed in unstimulated samples from cell suspensions versus scraped cell samples obtained from RAW 264.7 macrophages. Figure 5C. Fragmentation Pattern for 38:4 PIP2. http://www.signaling-gateway.org Figure 3. Polyphosphoinositide Extraction Protocol. Table 1. Results of RAW 264.7 Stimulation Table 1. Results of RAW 264.7 Stimulation Table 1. Results of RAW 264.7 Stimulation Table 1. Results of RAW 264.7 Stimulation