Download
1 / 29
290 likes | 430 Views
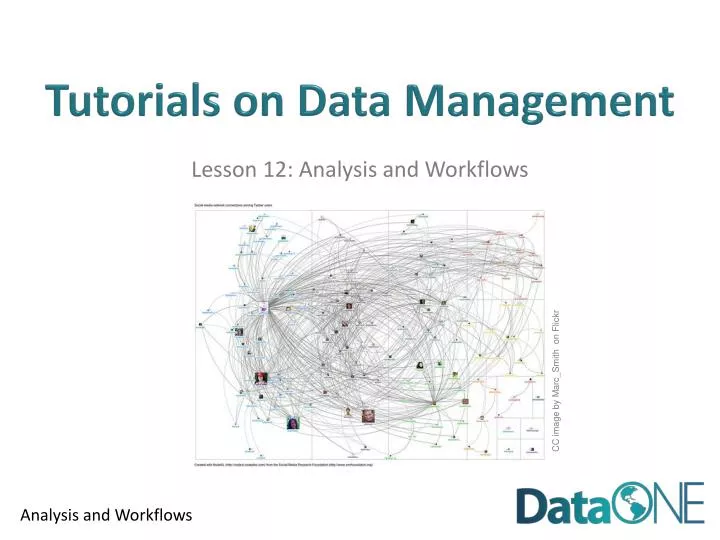
Tutorials on Data Management. Lesson 12: Analysis and Workflows. CC image by Marc_Smith on Flickr. Topics. Review of typical data analyses Reproducibility & provenance Workflows in general Computer-based scientific workflows (SWF) Benefits of SWF Examples of SWF and associated tools.

E N D
Tutorials on Data Management Lesson 12: Analysis and Workflows CC image by Marc_Smith on Flickr
Topics • Review of typical data analyses • Reproducibility & provenance • Workflows in general • Computer-based scientific workflows (SWF) • Benefits of SWF • Examples of SWF and associated tools
Learning Objectives • After completing this lesson, the participant will be able to: • Understand a subset of typical analyses used • Define a workflow • Define a SWF • Discuss the benefits of workflows in general and SWF in particular • Locate resources for using SWF
Data Analyses • Conducted via personal computer, grid, cloud computing • Statistics, model runs, parameter estimations, graphs/plots etc.
Types of Analyses • Processing: subsetting, merging, manipulating • Reduction: important for high-resolution datasets • Transformation: unit conversions, linear and nonlinear algorithms Date time air temp precip C mm 11-Jul-07 5:00 27.6 000 11-Jul-07 6:00 27.6 000 11-Jul-07 7:00 27.7 003 11-Jul-07 8:00 28.2 017 11-Jul-07 9:00 28.5 000 11-Jul-07 10:00 29.3 000 11-Jul-07 11:00 30.1 000 11-Jul-07 12:00 30.4 000 0711070500276000 0711070600276000 0711070700277003 0711070800282017 0711070900285000 0711071000293000 0711071100301000 0711071200304000 Recreated from Michener & Brunt (2000)
Types of Analyses • Graphical analyses • Visual exploration of data: search for patterns • Quality assurance: outlier detection Scatter plot of August Temperatures Box and whisker plot of temperature by month Strasser, unpub. data Strasser, unpub. data
Types of Analyses Example of Principle Component Analysis • Statistical analyses Conventional statistics • Experimental data • Examples: ANOVA, MANOVA, linear and nonlinear regression • Rely on assumptions: random sampling, random & normally distributed error, independent error terms, homogeneous variance Descriptive statistics • Observational or descriptive data • Examples: diversity indices, cluster analysis, quadrant variance, distance methods, principal component analysis, correspondence analysis From Oksanen (2011) Multivariate Analysis of Ecological Communities in R: vegan tutorial
Types of Analyses • Statistical analyses (continued) • Temporal analyses: time series • Spatial analyses: for spatial autocorrelation • Nonparametric approaches useful when conventional assumptions violated or underlying distribution unknown • Other misc. analyses: risk assessment, generalized linear models, mixed models, etc. • Analyses of very large datasets • Data mining & discovery • Online data processing
After Data Analysis • Re-analysis of outputs • Final visualizations: charts, graphs, simulations etc. Science is iterative: The process that results in the final product can be complex
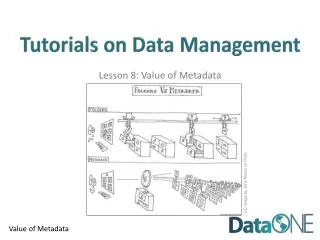
Reproducibility • Reproducibility at core of scientific method • Complex process = more difficult to reproduce • Good documentation required for reproducibility • Metadata: data about data • Process metadata: data about process used to create, manipulate, and analyze data CC image by Felix63 on Flickr
Process Metadata • Information about process used to get to data outputs • Related concept: data provenance • Origins of data • Good provenance = able to follow data throughout entire life cycle • Allows for • Replication & reproducibility • Analysis for potential defects, errors in logic, statistical errors • Evaluation of hypotheses
Workflows in General • Formalization of process metadata • Precise description of scientific procedure • Conceptualized series of data ingestion, transformation, and analytical steps • Three components • Inputs: information or material required • Outputs: information or material produced & potentially used as input in other steps • Transformation rules/algorithms (e.g. analyses)
Workflows in General • Simplest form of workflow: flow chart Data import into R Quality control & data cleaning Analysis: mean, SD Graph production
Workflows in General • Simplest form of workflow: flow chart Transformation Rules Data import into R Quality control & data cleaning Analysis: mean, SD Graph production
Workflows in General • Simplest form of workflow: flow chart Inputs & Outputs Temperature data Data import into R Data in R format Salinity data Quality control & data cleaning “Clean” T & S data Analysis: mean, SD Summary statistics
Workflows in General • Science is becoming more computationally intensive • Sharing workflows benefits science • Scientific workflow systems make documenting workflows easier • Simplest workflows: scripted languages
Scientific Workflows (SWF) • Analytical pipeline • Each step can be implemented in different software systems • Each step & its parameters/requirements formally recorded • Allows reuse of both individual steps and overall workflow
Benefits of SWF • Single access point for multiple analyses across software packages • Keeps track of analysis and provenance: enables reproducibility • Each step & its parameters/requirements formally recorded • Workflow can be stored • Allows sharing and reuse of individual steps or overall workflow • Automate repetitive tasks • Use across different disciplines and groups • Can run analyses more quickly since not starting from scratch
Example of SWF: Kepler • Open-source, free, cross-platform • Drag-and-drop interface for workflow construction • Steps (analyses, manipulations etc) in workflow represented by “actor” • Actors connect from a workflow • Possible applications • Theoretical models or observational analyses • Hierarchical modeling • Can have nested workflows • Can access data from web-based sources (e.g. databases) • Downloads and more information at kepler-project.org
Example of SWF: Kepler Actors in workflow Drag & drop components from this list
Example of SWF: Kepler This model shows the solution to the classic Lotka-Volterra predator prey dynamics model. It uses the Continuous Time domain to solve two coupled differential equations, one that models the predator population and one that models the prey population. The results are plotted as they are calculated showing both population change and a phase diagram of the dynamics.
Example of SWF: Kepler Resulting output
Other SWF Tools: VisTrails • Open-source • Workflow & provenance management support • Geared toward exploratory computational tasks • Can manage evolving SWF • Maintains detailed history about steps & data • www.vistrails.org Screenshot example
Other SWF Tools: myExperiment • Social networking site to support scientists that use SWF • Allows searching for, sharing, reuse of SWF • Can comment on and discuss contributed SWF • Gateway to journals and data repositories • www.myexperiment.org
Best Practices for Data Analysis • Scientists should document workflows used to create results • Data provenance • Analyses and parameters used • Connections between analyses via inputs and outputs • Documentation can be informal (e.g. flowchart) or formal (e.g. Kepler)
Summary • Modern science is computer-intensive • Heterogeneous data, analyses, software • Reproducibility is important • Workflows = process metadata • Necessary for reproducibility, repeatability, validation • SFW offers formal systems for documenting process metadata • Storage, sharing, visualization, reuse
Resources for Data Analysis & SWF • Y. Gil, E. Deelman, M. Ellisman, T. Fahringer, G. Fox et al. Examining the Challenges of Scientific Workflows. Computer40,24–32 (2007). • K. Michener, J. Beach, M. Jones, B. Ludäscher, D. Pennington et al. A knowledge environment for the biodiversity and ecological sciences. J. Intel. Info. Sys. 29, 111–126 (2007). • B. Ludäscher, I. Altintas, S. Bowers, J. Cummings, T. Critchlowet al. Scientific Process Automation and Workflow Management. Comp. Sci. Ser. Ch 13 (Chapman and Hall, Boca Raton, 2009). • T. McPhillips, S. Bowers, D. Zinn, B. Ludäscher. Scientific workflow design for mere mortals. Fut. Gen. Comp. Sys. 25, 541-551 (2009). • B. Ludäscher, I. Altintas, C. Berkley, D. Higgins, E. Jaeger-Frank et al. Scientific workflow management and the kepler system. Conc. Comp. Prac. Exper., 18 (2006). • W. Michener and J. Brunt, Eds. Ecological Data: Design, Management and Processing. (Blackwell, New York, 2000).
Before you go . . . We want to hear from you! CLICK the arrow to take our short survey.