Download
1 / 11
110 likes | 228 Views
Explore the dynamics of consumer and producer surplus, joint supply, composite demand, and derived demand in economics. Understand the impact of price changes on various goods and their interdependent relationships.

E N D
Joint Supply • Where an increase/decrease in supply of one good leads to an increase/decrease in supply of another • Beef/hides, Lamb/wool, oil/fuels, milk/dairy products, cocoa/husks, etc.
Joint Supply S Petrol S Oil Price Price S1 15 Surplus 6 10 5 D1 D D 100 150 95 120 80 Quantity bought and sold Quantity bought and sold
Composite Demand • Where goods have more than one use – an increase in the demand for one leads to a fall in supply of the other • Milk – used for cheese, yoghurts, cream, butter, etc. • If more milk is used for cheese, ceteris paribusthere is less available for butter
Composite Demand S1 S Milk S Cheese Price Price 20 9 6 10 Shortage D1 D D 100 130 20 50 80 Quantity bought and sold Quantity bought and sold
Derived Demand • Where the demand for one good is dependent on the demand for another related good • Construction industry – demand for new office construction – demand for office space • Demand for construction workers – demand for construction work • Factor markets – derived demand
Derived Demand S Plasterers Wage Rate (£ per hour) Price (000s) S Houses 20 200 Shortage 12 180 D1 D1 D D 100 130 80 90 120 Quantity hired Quantity bought and sold
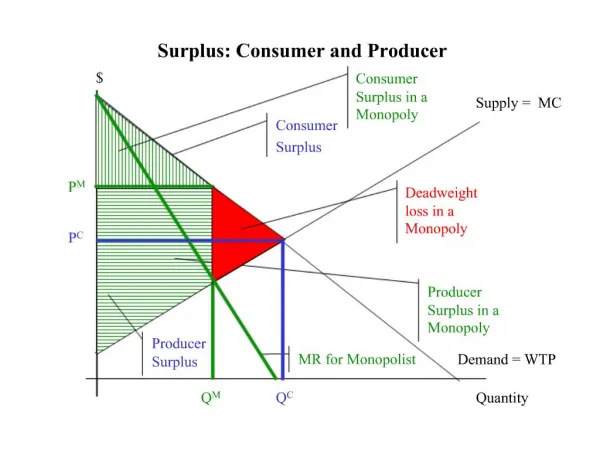
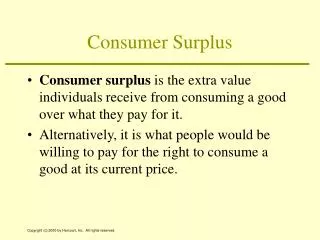
Consumer Surplus • The difference between the price that a consumer is prepared to pay and the actual price paid • Related to the value we place on items • Linked to the degree of utility • Useful concept in analysing welfare gains and losses as a result of resource allocation • Emphasis on the MARKET demand – of those in the market there are some who are willing to pay higher prices than the market price
Consumer Surplus Price (£) Market Price = £5 20 consumers willing to pay £5 15 Consumers WILLING to pay £9 These 15 consumers get 15 x £4 of consumer surplus 9 Total utility = value represented by blue and gold area 5 Blue area is amount paid to acquire good. Gold area = total consumer surplus D = Marginal Utility 15 20 Quantity Demanded
Producer Surplus • Difference between the market price received by the seller and the price they would have been prepared to supply at • Price received – linked to factor cost + element of normal profit • Producer surplus = abnormal profit
Producer Surplus Price (£) Market price = £10 S At £10, suppliers willing to offer 60 for sale 10 Total Revenue = blue area £10 x 60 = £600 Some suppliers would have offered 35 for sale at £6: Producer surplus = 35 x £4 = £140 6 Gold area = Producer surplus Quantity Supplied 60 35