Download
1 / 24
250 likes | 490 Views
Janice Lage, MD Department Chairman. Nancy Reilly Dixon , MPA Director of Laboratory Services. Pathology and Laboratory Medicine February 17, 2011. Frederick Nolte, Ph.D. Director of Clinical Laboratories. Tab 1 COM Departments involved in SP SP Strategic Goals (3-5 year big bets)

E N D
Janice Lage, MD Department Chairman Nancy Reilly Dixon , MPA Director of Laboratory Services Pathology and Laboratory MedicineFebruary 17, 2011 Frederick Nolte, Ph.D. Director of Clinical Laboratories
Tab 1 • COM Departments involved in SP • SP Strategic Goals (3-5 year big bets) • 2010-2011 Progress towards Strategic Goals • What is going well in SP? • Opportunities for improvement in SP • SP Leaders input on SL as a structure Tab 2 – SP Dashboard Tab 3 – SP Goal (LEM) Performance • Executive Summary – Annual LEM Performance • Executive Summary – 2011 Pillar Performance YTD • 2011 LEM Monthly Report Card Tab 4 – SP 5/5 Plans • Performance YTD towards goal • Plan Tab 5 – Miscellaneous Reports
COM Departments involved in SP • Anesthesia and Perioperative Medicine • Dermatology • Family Medicine • Medicine • Neurosciences • Obstetrics and Gynecology • Ophthalmology • Orthopedics • Otolarynology • Pediatrics • Psychiatry and Behavioral Sciences • Radiation Oncology • Radiology • Surgery • Urology
Enhance MUHA Molecular Oncology Testing Program Promote Evidence-Based Utilization of Laboratory Tests and Blood Products Develop Integrated System for Rapid Breast Cancer Diagnosis Improve Patient Safety Improve Outpatient Satisfaction Decrease Cost of Send Out Tests SP Big Bets (3-5 year strategic goals)
2010-2011 Progress towards Big Bets • Enhance Molecular Oncology Testing Program to provide better diagnosis and therapy for patients with cancer • Newly created research associate position to develop in-house test offerings (e.g. KRAS, BRAF, EGFR mutation analysis; chimerism testing; B&T cell clonality analysis; quantitative BCR/ABL mRNA assay)
2010-2011 Progress towards Big Bets • Promote Evidence-Based Utilization of Laboratory Tests and Blood Products • 5/5 plans focused on reducing unnecessary testing • CK/CKMB decreased from 60 to 10 tests per day ($600/day, $219K/yr) • Duplicate Troponins decreased from 12 to 2 per day @ 11.06/test ($110.6/day, $7K/yr) • Working with SLs to improve blood product utilization • Projects in progress: HCC, CH, STICU/MSICU, DD, L&D, Perinatal Service • Lab developed report for screening transfusion appropriateness by med/surg specialty • Real time monitoring of coagulation status by lab during surgery to improve blood product use (Thromboelastography go-live testing Jan 24)
2010-2011 Progress towards Big Bets • Develop Integrated System for Rapid Breast Cancer Diagnosis to promote collaboration between Radiology, Pathology and Oncology • Approved capital purchase of rapid tissue processor to allow same day diagnosis of tissue biopsies • Creation of a breast subspecialty pathology diagnostic sign-out
2010-2011 Progress towards Big Bets • Improve Patient Safety • Decreased hospital blood culture contamination rates (2% decrease from 2009 rates) • Positive patient ID at bedside to reduce mislabeled specimens (Rollout to begin June 2011) • Surgical Pathology Specimen Tracking System (implemented in Anatomic Pathology Lab) • Improved blood product utilization
2010-2011 Progress towards Big Bets • Improve Outpatient Satisfaction (Current overall score 94%. Average score in 2010 was 87%.) • Individualized patient care initiative • Increased emphasis on customer service training for phlebotomists • Redefined scope of responsibilities for Daily Operations Phlebotomy Coordinator
Decrease Cost of Send Out Tests Direct patient billing by referral lab (FYTD savings: $157,060) Specimen collection reimbursement program (FYTD savings: $6,920) Better utilization of expensive genetic referral tests (FYTD savings: $6,000) Decreased reliance on referral testing by offering in-house testing based on trend analysis and/or clinical need (savings since May 2010: $105,000) 2010-2011 Progress towards Big Bets
Effective collaboration between Strategic Partner and Service Lines Excellent working relationships between Medical Directors and Laboratory Management 5/5 Plans resulting in quantifiable savings Lab developed transfusion appropriateness screening tool Outpatient satisfaction improvement What is going well in SP?
Success in achieving goals often dependent on changing established physician ordering practices Adequate and pertinent clinical history not provided with surgical specimens Standardized and consistent use of Practice Partner by physicians in ordering laboratory tests is needed Electronic physician signature needed on all Practice Partner lab orders Limited coverage tests need appropriate ICD9 codes assigned to meet medical necessity Opportunities for improvement in SP
Positives Promotes opportunity for collaboration between hospital and physicians Better delineation of service leads to better understanding of SL needs by support services Challenges SP not included in SL strategic planning Input on SL as a structure
Tab 3Goal Performance • Executive Summary – Annual LEM performance • Executive Summary – 2011 Pillar performance YTD • 2011 LEM Monthly Report Card
SP Goal (LEM) PerformanceExecutive Summary - Annual Green – 4; Yellow – 3; Red - <2.5 Scale 1-5; 4 is goal attainment
SLL Goal (LEM) PerformanceExecutive Summary – YTD 5 – Labor 1 - Supplies Green – 4; Yellow – 3; Red - <2.5 Scale 1-5; 4 is goal attainment
Tab 4SL 5/5 Performance YTD • 5/5 Performance YTD • 5/5 Plan Executive Summary
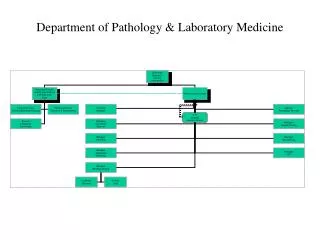
Tab 5Miscellaneous Reports Service-Specific Transfusion Evaluation Report Pathology and Laboratory Services Organizational Chart