Download
1 / 20
200 likes | 304 Views
Explore the geomagnetic measurements in South Korea from 1976 to 2010, including the data distribution, declination, and total magnetic intensity. The National Geography Information Institute (NGII) has been making geomagnetic charts based on measured data to update the geological maps for public use. Discover the process of eliminating outlier data and the comparison with IGRF11 models. The commitment to accurate measurements and producing updated geomagnetic charts highlights the importance of this data for geographical mapping.

E N D
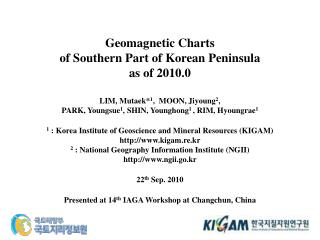
Geomagnetic Charts of Southern Part of Korean Peninsula as of 2010.0 LIM, Mutaek*1, MOON, Jiyoung2, PARK, Youngsue1, SHIN, Younghong1 , RIM, Hyoungrae1 1 : Korea Institute of Geoscience and Mineral Resources (KIGAM) http://www.kigam.re.kr 2 : National Geography Information Institute (NGII) http://www.ngii.go.kr 22th Sep. 2010 Presented at 14th IAGA Workshop at Changchun, China
Contents Present status of geomag. meas. in south. part of Korea NGII is to make geomag. charts from measured data Geomag. charts as of 1990.0 from data meas. 1976 - 1996 Geomag. charts as of 2010.0 from data meas. 1998 - 2008 Geomag. charts as of 2010.0 from data newly meas. 2010 Concluding Remarks
Present status of geomag. meas. in south. part of Korea - 1 China KIGAM RRL KMA Changchun Korea Location of Geomag. Obs. Beijing YON ICN HOS DZN CHN GZU JEJ Japan
Present status of geomag. meas. in south. part of Korea - 2 Location of Geomag. Obs. Summary of Geom. Obs. in Korea China Korea YON ICN HOS DZN CYN GZU JEJ Japan KIGAM : Kor. Inst. Geosc. & Min. Res. RRL : Radio Res. Lab. KMA : Kor. Meteor. Agency
NGII is to make geomag. charts from measured data Main & visible purpose for NGII to make geomagnetic charts is the necessity to put the declination on the geographical maps provided to the people. NGII has done absolute geomagnetic measurements on repeat stations and/or on random points: 1976 ~ 1996 : on more than 500 random points including repeat stations, total 902 meas.-pt. 1998 ~ 2008 : on only 30 repeat stations, total 74 meas.-pt. NGII committed to KIGAM to make geomagnetic charts of total magnetic intensity, declination and inclination as of 1990.0 and as of 2010.0 with the data measured by NGII. This can be considered to be an additional work to the main work below. And NGII committed to KIGAM to do absolute geomagnetic measurements on the whole of 30 repeat stations in the year of 2010, to make geomagnetic charts with the newly measured data, and to compare the two sets of charts of the year 2010. 0. The absolute geomagnetic measurements are under doing now.
Geomag. charts as of 1990.0 from data meas. 1976 – 1996 - 1 Assuming that local distribution of geomagnetic features(tot. mag. intens., dec., inc.) vary very smoothly, and therefore Considering IGRF as exemplary, many outlying data from the IGRF were eliminated. The greatest deficiency of the data set being the non-existence of the measurement date and time records, we have imagined that each measurement has been done in the middle of the year. So, there would be considerable errors on geomagnetic features(tot. mag. intens., dec., inc.), especially more on declination than on inclination.
Geomag. charts as of 1990.0 from data meas. 1976 – 1996 - 2 Final constraints applied to eliminate the meas.-pt. thought to have considerable deficiency : if abs(tot. mag. intens. – IGRF11) > 500 nT or if abs(dec. – IGRF11) > 0.5 deg or if abs(inc. – IGRF11) > 0.5 deg Reduced data distribution : 773 meas.-pt. Reduced data distribution : 677 meas.-pt. Original data distribution : 902 meas.-pt. Finally reduced data distribution : 593meas.-pt.
Geomag. charts as of 1990.0 from data meas. 1976 – 1996 - 3 Original data distribution of difference of each feature – IGRF11 Constraints applied Finally reduced data distribution of difference of each feature – IGRF11
Geomag. charts as of 1990.0 from data meas. 1976 – 1996 - 4 Final geomagnetic charts as of 1990.0 in comparison with the IGRF11
Geomag. charts as of 2010.0 from data meas. 1998 – 2008 - 1 Also assuming that local distribution of geomagnetic features(tot. mag. intens., dec., inc.) vary very smoothly, and therefore Considering IGRF as exemplary, several outlying data from the IGRF were eliminated. The considerable deficiency of the data set being the non-existence of the measurement time records, we have imagined that each measurement has been done in the middle of the day. So, there would be some errors on geomagnetic features(tot. mag. intens., dec., inc.), especially more on declination than on inclination.
Geomag. charts as of 2010.0 from data meas. 1998 – 2008 - 2 : measured values for rep. stn. No. 1, - : values calculated from IGRF11
Geomag. charts as of 2010.0 from data meas. 1998 – 2008 - 3 Final constraints applied to eliminate the meas.-pt. thought to have considerable deficiency : if abs(tot. mag. intens. – IGRF11) > 500 nT or if abs(dec. – IGRF11) > 0.5 deg or if abs(inc. – IGRF11) > 0.5 deg Original data distribution : 74 meas.-pt. Finally reduced data distribution : 72 meas.-pt.
Geomag. charts as of 2010.0 from data meas. 1998 – 2008 - 4 Original data distribution of difference of each feature – IGRF11 Constraints applied Finally reduced data distribution of difference of each feature – IGRF11
Geomag. charts as of 2010.0 from data meas. 1998 – 2008 - 5 Final geomagnetic charts as of 2010.0 in comparison with the IGRF11
Geomag. charts as of 2010.0 from data newly meas. 2010 - 1 To ameliorate the quality of geomagnetic charts to be made from newly measured data in 2010, we will add 3 works as follows; 1. to get site difference between each rep. stn. and geomagnetic observatories 2. to do magnetic survey to certify that each rep. stn. is at a place without any magnetic anomaly 3. to do at least 5 sessions of absolute geomagnetic measurements to get a believable baselines
Geomag. charts as of 2010.0 from data newly meas. 2010 - 2 to get site difference between each rep. stn. and geomagnetic observatories Derived difference -754.5 nT from Blue : CYN Geomagnetic Obs. Red : GZU Geomagnetic Obs. Set up of a magnetometer
Geomag. charts as of 2010.0 from data newly meas. 2010 - 3 to do magnetic survey to certify that each rep. stn. is at a place without any magnetic anomaly Magnetic survey result on rep. stn. no. 22 Left : total mag. Intens. (nT) Right : gradient (nT/m) Magnetic survey
Geomag. charts as of 2010.0 from data newly meas. 2010 - 4 to do at least 5 sessions of absolute geomagnetic measurements to get a believable baselines excel file of 1 measurement
Geomag. charts as of 2010.0 from data newly meas. 2010 - 4 to do at least 5 sessions of absolute geomagnetic measurements to get a believable baselines Summary of 6 measurements with baselines calculated Quality?
Concluding remarks Geomag. charts as of 1990.0 were made from data meas. 1976 – 1996 by eliminating considerable no. of original meas.-pt. Geomag. charts as of 2010.0 were also made from data meas. 1998 – 2008 by eliminating a little of original meas.-pt. Geomag. charts as of 2010.0 with an ameliorated quality will be made from data newly meas. 2010 by applying all generally used methods. We will do everything to get a more reasonable result than the olders. Thank you for your attention!