Download
1 / 33
330 likes | 435 Views
Learn about signal propagation effects, antenna phase center variations, atmospheric delay modeling, and more affecting GPS vertical accuracy. Explore solutions for precise measurements and error reduction strategies.

E N D
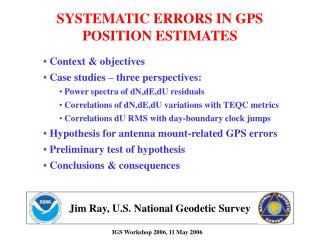
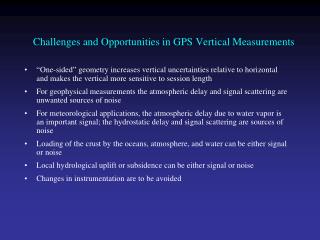
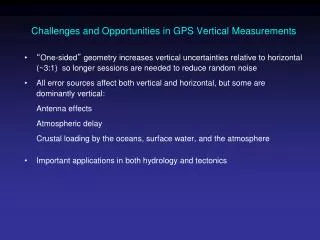
Modeling Errors in GPS Vertical Estimates • Signal propagation effects • Signal scattering ( antenna phase center/multipath ) • Atmospheric delay ( parameterization, mapping functions ) • Unmodeled motions of the station • Monument instability / local groundwater • Loading of the crust by atmosphere, oceans, and surface water “One-sided” geometry increases vertical uncertainties relative to horizontal and makes the vertical more sensitive to session length
Modeling Errors in GPS Vertical Estimates • Signal propagation effects • Signal scattering ( antenna phase center/multipath ) • Atmospheric delay ( parameterization, mapping functions ) • Unmodeled motions of the station • Monument instability / local groundwater • Loading of the crust by atmosphere, oceans, and surface water
Modeling Antenna Phase-center Variations (PCVs) • Ground antennas • Relative calibrations by comparison with a ‘standard’ antenna (NGS, used by the IGS prior to November 2006) • Absolute calibrations with mechanical arm (GEO++) or anechoic chamber • May be depend on elevation angle only or elevation and azimuth • Current models are radome-dependent • Errors for some antennas can be several cm in height estimates • Satellite antennas (absolute) • Estimated from global observations (T U Munich) • Differences with evolution of SV constellation mimic and scale change Recommendation for GAMIT: Use latest IGS absolute ANTEX file (absolute) with AZ/EL for ground antennas and ELEV (nadir angle) for SV antennas
Top: PBO station near Lind, Washington. Bottom: BARD station CMBB at Columbia College, California
Left: Phase residuals versus elevation for Westford pillar, without (top) and with (bottom) microwave absorber. Right: Change in height estimate as a function of minimum elevation angle of observations; solid line is with the unmodified pillar, dashed with microwave absorber added [From Elosequi et al.,1995]
Antenna Ht 0.15 m 0.6 m Simple geometry for incidence of a direct and reflected signal 1 m Multipath contributions to observed phase for three different antenna heights [From Elosegui et al, 1995]
Modeling Errors in GPS Vertical Estimates • Signal propagation effects • Signal scattering ( antenna phase center/multipath ) • Atmospheric delay ( parameterization, mapping functions ) • Unmodeled motions of the station • Monument instability / local groundwater • Loading of the crust by atmosphere, oceans, and surface water
GPS adjustments to atmospheric zenith delay for 29 June, 2003; southern Vancouver Island (ALBH) and northern coastal California (ALEN). Estimates at 2-hr intervals.
Effect of Neutral Atmosphere on GPS Measurements Slant delay = (Zenith Hydrostatic Delay) * (“Dry” Mapping Function) + (Zenith Wet Delay) * (Wet Mapping Function) • ZHD well modeled by pressure (local sensors or global model, GPT) • Analytical mapping functions (GMF) work well to 10 degrees • ZWD cannot be modeled with local temperature and humidity - must estimate using the wet mapping function as partial derivatives • Because the wet and dry mapping functions are different, errors in ZHD can cause errors in estimating the wet delay (and hence total delay) .
Percent difference (red) between hydrostatic and wet mapping functions for a high latitude (dav1) and mid-latitude site (nlib). Blue shows percentage of observations at each elevation angle. From Tregoning and Herring [2006].
Difference between a) surface pressure derived from “standard” sea level pressure and the mean surface pressure derived from the GPT model. b) station heights using the two sources of a priori pressure.c) Relation between a priori pressure differencesand height differences. Elevation-dependent weighting was used in the GPS analysis with a minimum elevation angle of 7 deg.
Differences in GPS estimates of ZTD at Algonquin, Ny Alessund, Wettzell and Westford computed using static or observed surface pressure to derive the a priori. Height differences will be about twice as large. (Elevation-dependent weighting used).
Modeling Errors in GPS Vertical Estimates • Signal propagation effects • Signal scattering ( antenna phase center/multipath ) • Atmospheric delay ( parameterization, mapping functions ) • Unmodeled motions of the station • Monument instability / local groundwater • Loading of the crust by atmosphere, oceans, and surface water
Modeling Errors in GPS Vertical Estimates • Signal propagation effects • Signal scattering ( antenna phase center/multipath ) • Atmospheric delay ( parameterization, mapping functions ) • Unmodeled motions of the station • Monument instability / local ground water • Loading of the crust by atmosphere, oceans, and surface water
Atmosphere (purple) 2-5 mm Snow/water (blue) 2-10 mm Nontidal ocean (red) 2-3 mm Annual vertical loading effects on site coordinates From Dong et al. J. Geophys. Res., 107, 2075, 2002
Vertical (a) and north (b) displacements from pressure loading at a low-latitude site (S. Africa). Bottom is power spectrum. From Petrov and Boy (2004)
Vertical (a) and north (b) displacements from pressure loading at a mid-latitude site (Germany). Bottom is power spectrum.
Spatial and temporal autocorrelation of atmospheric pressure loading From Petrov and Boy, J. Geophys. Res.,109, B03405, 2004
Atmosphere (purple) 2-5 mm Snow/water (blue) 2-10 mm Nontidal ocean (red) 2-3 mm Annual vertical loading effects on site coordinates From Dong et al. J. Geophys. Res., 107, 2075, 2002
Station height estimates for Rio Grande, Argentina, using pressure from height-corrected STP, GPT and actual observations (MET). Dashed black line shows observed surface pressure; pink line shows atmospheric pressure loading deformation (corrected for in the GPS analyses) , offset by 2.07 m.
Correlation between estimates of height and zenith delay as function of minimum elevation angle observed (VLBI, from Davis [1986])
Uncertainty in estimated height as function of minimum elevation angle observed (VLBI, from Davis [1986]; dotted line with no zenith delay estimated)
Height (red: simulated; black: estimated) and ZTD (green: simulated; blue: estimated) errors versus latitude as a function of error in surface pressure used to calculate the a priori ZHD. Uniform 10 mm data weighting applied.
Height (black/blue) and ZTD (red/green) errors at Davis, Antarctica, for different elevation cutoff angles as a function of error in surface pressure used to calculate the a priori ZHD.. Results shown for both elevation-dependent (blue and red results) and constant data weighting (black and green).