Download
1 / 13
130 likes | 150 Views
Antigua Topography. > 350 m. 17.20 N. 300. 200. 61.925 W. 100. 0. 61. 65 W. sea level. Ross Wagenseil for PGDM April 2001. < - 50 m. KILOMETERS. ARC-MINUTES. 10. MILES. 5. 5. 10yr. 25yr. 50yr. 100yr. SELECT. Wind. Wave. PGDM May 2001. Surge. 5. 16.98 N. 0. 0.

E N D
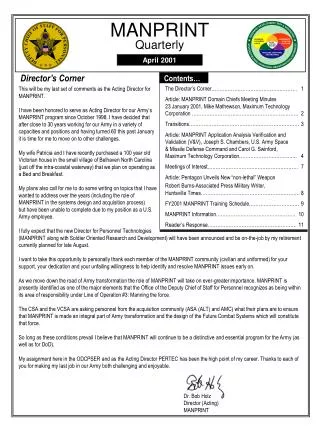
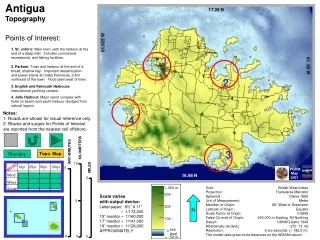
Antigua Topography > 350 m 17.20 N 300 200 61.925 W 100 0 61. 65 W sea level Ross Wagenseil for PGDM April 2001 < - 50 m KILOMETERS ARC-MINUTES 10 MILES 5 5 10yr 25yr 50yr 100yr SELECT Wind Wave PGDM May 2001 Surge 5 16.98 N 0 0 0 Points of Interest: 1. St. John’s: Main town, with the harbour at the end of a deep inlet. Includes commercial, recreational, and fishing facilities. 1 2. Parham: Town and harbour at the end of a broad, shallow bay. Important desalinization and power plants at Crabs Peninsula, 2 Km northeast of the town. Flood plain west of town. 1 2 3. English and Falmouth Harbours: International yachting centers. 4. Jolly Harbour: Major resort complex with hotel on beach and yacht harbour dredged from natural lagoon. Notes: 1. Roads are shown for visual reference only. 2. Waves and surges for Points of Interest are reported from the nearest cell offshore. 3 4 3 Topo. Map Directory Grid: British West Indies Projection: Transverse Mercator Spheroid: Clarke 1880 Unit of Measurement: Meter Meridian of Origin: 62° West of Greenwich Latitude of Origin : Equator Scale Factor at Origin: 0.9995 False Co-ords of Origin: 400,000 m Easting, Nil Northing Datum: USNHO Astro 1943 Molodensky dx/dy/dz: -270 13 62 Resolution: 6 arc-seconds. (~ 182.5 m) The model used great-circle distances on the WGS84 datum. Scale varies with output device: Letter paper, 8½” X 11” ~ 1/172,000 15” monitor ~ 1/160,000 17” monitor ~ 1/141,000 19” monitor ~ 1/126,000 APPROXIMATELY N
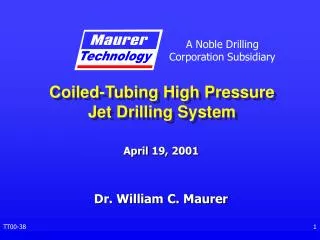
17.20 N 61.925 W 61. 65 W Ross Wagenseil for PGDM April 2001 KILOMETERS ARC-MINUTES 10 MILES 5 5 10yr 25yr 50yr 100yr SELECT Wind Wave PGDM May 2001 Surge 5 16.98 N 0 0 Wind Speeds 0 1 2 3 4 5 Storm Category knots 25 50 75 100 125 mph 25 50 75 100 150 125 kph 50 100 150 200 250 Min m/s 20 60 10 30 40 50 70 0 Max Winds Probability 10% / year, 10-Year Return Time Antigua 1. St. John’s Downtown 27 m/s East side of town 32 m/s 1 2. Parham Desalinization plant 31 m/s Waterfront by town 29 m/s Hill above town 33 m/s 2 3. English and Falmouth Harbours Nelson’s Dockyard 30 m/s Falmouth SE 25 m/s Falmouth NW 32 m/s 4. Jolly Harbour Channel entrance 27 m/s Inner boat basin 26 m/s Beach front 28 m/s 4 N 3 Directory Topo. Map
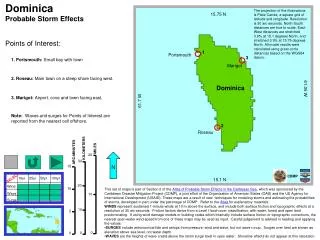
17.20 N 61.925 W 61. 65 W Ross Wagenseil for PGDM April 2001 KILOMETERS ARC-MINUTES 10 MILES 5 5 10yr 25yr 50yr 100yr SELECT Wind WaveHeights Wave PGDM May 2001 Surge 5 16.98 N 0 0 6 4 1 3 5 2 7 Meters 5 10 25 Feet 20 15 Min 0 Max Waves Probability 10% / year, 10-Year Return Time Antigua 1. St. John’s Waterfront by market 1.3 m North of Rat Island 1.1 m Cruise Ship terminal 0.1 m Week Point3.0 m 1 2. Parham Desalinization plant 1.6 m Waterfront by town 1.4 m Flood plain west of town 0.9 m 2 3. English and Falmouth Harbours Nelson’s Dockyard 1.2 m Falmouth SE 1.2 m Falmouth NW 1.5 m 4 4. Jolly Harbour Channel entrance 1.2 m Inner boat basin 1.2 m Beach front 1.1 m N 3 Directory Topo. Map
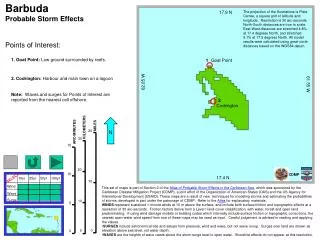
17.20 N 61.925 W 61. 65 W Ross Wagenseil for PGDM April 2001 KILOMETERS ARC-MINUTES 10 MILES 5 5 10yr 25yr 50yr 100yr SELECT Wind Wave Surge Heights PGDM May 2001 Surge 5 16.98 N 0 0 1 2 3 4 6 5 Meters 20 15 10 5 Feet Min 0 Max Surges Probability 10% / year, 10-Year Return Time Antigua 1. St. John’s Waterfront by market 0.4 m North of Rat Island 0.4 m Cruise Ship terminal 0.4 m 1 2. Parham Desalinization plant 0.5 m Waterfront by town 0.6 m Flood plain west of town 0.2 m 2 3. English and Falmouth Harbours Nelson’s Dockyard 0.2 m Falmouth SE 0.2 m Falmouth NW 0.2 m 4 4. Jolly Harbour Channel entrance 0.3 m Inner boat basin 0.3 m Beach front 0.3 m N 3 Directory Topo. Map Note: surges are reported as elevation above sea level, not depth of water.
17.20 N 61.925 W 61. 65 W Ross Wagenseil for PGDM April 2001 KILOMETERS ARC-MINUTES 10 MILES 5 5 10yr 25yr 50yr 100yr SELECT Wind Wave PGDM May 2001 Surge 5 16.98 N 0 0 Wind Speeds 0 1 2 3 4 5 Storm Category knots 25 50 75 100 125 mph 25 50 75 100 150 125 kph 50 100 150 200 250 Min m/s 20 60 10 30 40 50 70 0 Max Winds Probability 4% / year, 25-Year Return Time Antigua 1. St. John’s Downtown 36 m/s East side of town 40 m/s 1 2. Parham Desalinization plant 39 m/s Waterfront by town 37 m/s Hill above town 42 m/s 2 3. English and Falmouth Harbours Nelson’s Dockyard 38 m/s Falmouth SE 33 m/s Falmouth NW 41 m/s 4. Jolly Harbour Channel entrance 36 m/s Inner boat basin 35 m/s Beach front 36 m/s 4 N 3 Directory Topo. Map
17.20 N 61.925 W 61. 65 W Ross Wagenseil for PGDM April 2001 KILOMETERS ARC-MINUTES 10 MILES 5 5 10yr 25yr 50yr 100yr SELECT Wind WaveHeights Wave PGDM May 2001 Surge 5 16.98 N 0 0 6 4 1 3 5 2 7 Meters 5 10 25 Feet 20 15 Min 0 Max Waves Probability 4% / year, 25-Year Return Time Antigua 1. St. John’s Waterfront by market 1.3 m North of Rat Island 1.3 m Cruise Ship terminal 1.0 m Week Point 3.3 m 1 2. Parham Desalinization plant 1.6 m Waterfront by town 1.7 m Flood plain west of town 0.5 m 2 3. English and Falmouth Harbours Nelson’s Dockyard 1.3 m Falmouth SE 1.3 m Falmouth NW 1.5 m 4 4. Jolly Harbour Channel entrance 1.3 m Inner boat basin 1.3 m Beach front 1.3 m N 3 Directory Topo. Map
17.20 N 61.925 W 61. 65 W Ross Wagenseil for PGDM April 2001 KILOMETERS ARC-MINUTES 10 MILES 5 5 10yr 25yr 50yr 100yr SELECT Wind Wave Surge Heights PGDM May 2001 Surge 5 16.98 N 0 0 1 2 3 4 6 5 Meters 20 15 10 5 Feet Min 0 Max Surges Probability 4% / year, 25-Year Return Time Antigua 1. St. John’s Waterfront by market 0.7 m North of Rat Island 0.8 m Cruise Ship terminal 0.7 m 1 2. Parham Desalinization plant 0.8 m Waterfront by town 1.0 m Flood plain west of town 1.8 m 2 3. English and Falmouth Harbours Nelson’s Dockyard 0.3 m Falmouth SE 0.3 m Falmouth NW 0.4 m 4 4. Jolly Harbour Channel entrance 0.5 m Inner boat basin 0.6 m Beach front 0.6 m N 3 Directory Topo. Map Note: surges are reported as elevation above sea level, not depth of water.
17.20 N 61.925 W 61. 65 W Ross Wagenseil for PGDM April 2001 KILOMETERS ARC-MINUTES 10 MILES 5 5 10yr 25yr 50yr 100yr SELECT Wind Wave PGDM May 2001 Surge 5 16.98 N 0 0 Wind Speeds 0 1 2 3 4 5 Storm Category knots 25 50 75 100 125 mph 25 50 75 100 150 125 kph 50 100 150 200 250 Min m/s 20 60 10 30 40 50 70 0 Max Winds Probability 2% / year, 50-Year Return Time Antigua 1. St. John’s Downtown 40 m/s East side of town 46 m/s 1 2. Parham Desalinization plant 45 m/s Waterfront by town 42 m/s Hill above town 47 m/s 2 3. English and Falmouth Harbours Nelson’s Dockyard 42 m/s Falmouth SE 36 m/s Falmouth NW 47 m/s 4. Jolly Harbour Channel entrance 40 m/s Inner boat basin 40 m/s Beach front 40 m/s 4 N 3 Directory Topo. Map
17.20 N 61.925 W 61. 65 W Ross Wagenseil for PGDM April 2001 KILOMETERS ARC-MINUTES 10 MILES 5 5 10yr 25yr 50yr 100yr SELECT Wind WaveHeights Wave PGDM May 2001 Surge 5 16.98 N 0 0 6 4 1 3 5 2 7 Meters 5 10 25 Feet 20 15 Min 0 Max Waves Probability 2% / year, 50-Year Return Time Antigua 1. St. John’s Waterfront by market 1.4 m North of Rat Island 1.4 m Cruise Ship terminal 1.2 m Week Point 3.6 m 1 2. Parham Desalinization plant 1.7 m Waterfront by town 1.8 m Flood plain west of town 0.6 m 2 3. English and Falmouth Harbours Nelson’s Dockyard 1.4 m Falmouth SE 1.4 m Falmouth NW 1.6 m 4 4. Jolly Harbour Channel entrance 1.5 m Inner boat basin 1.4 m Beach front 1.5 m N 3 Directory Topo. Map
17.20 N 61.925 W 61. 65 W Ross Wagenseil for PGDM April 2001 KILOMETERS ARC-MINUTES 10 MILES 5 5 10yr 25yr 50yr 100yr SELECT Wind Wave Surge Heights PGDM May 2001 Surge 5 16.98 N 0 0 1 2 3 4 6 5 Meters 20 15 10 5 Feet Min 0 Max Surges Probability 2% / year, 50-Year Return Time Antigua 1. St. John’s Waterfront by market 1.0 m North of Rat Island 1.0 m Cruise Ship terminal 1.0 m 1 2. Parham Desalinization plant 1.1 m Waterfront by town 1.3 m Flood plain west of town 2.4 m 2 3. English and Falmouth Harbours Nelson’s Dockyard 0.4 m Falmouth SE 0.5 m Falmouth NW 0.6 m 4 4. Jolly Harbour Channel entrance 0.8 m Inner boat basin 0.9 m Beach front 0.9 m N 3 Directory Topo. Map Note: surges are reported as elevation above sea level, not depth of water.
17.20 N 61.925 W 61. 65 W Ross Wagenseil for PGDM April 2001 KILOMETERS ARC-MINUTES 10 MILES 5 5 10yr 25yr 50yr 100yr SELECT Wind Wave PGDM May 2001 Surge 5 16.98 N 0 0 Wind Speeds 0 1 2 3 4 5 Storm Category knots 25 50 75 100 125 mph 25 50 75 100 150 125 kph 50 100 150 200 250 Min m/s 20 60 10 30 40 50 70 0 Max Winds Probability 1% / year, 100-Year Return Time Antigua 1. St. John’s Downtown 47 m/s East side of town 51 m/s 1 2. Parham Desalinization plant 50 m/s Waterfront by town 47 m/s Hill above town 53 m/s 2 3. English and Falmouth Harbours Nelson’s Dockyard 48 m/s Falmouth SE 41 m/s Falmouth NW 52 m/s 4 4. Jolly Harbour Channel entrance 45 m/s Inner boat basin 44 m/s Beach front 45 m/s N 3 Directory Topo. Map
17.20 N 61.925 W 61. 65 W Ross Wagenseil for PGDM April 2001 KILOMETERS ARC-MINUTES 10 MILES 5 5 10yr 25yr 50yr 100yr SELECT Wind WaveHeights Wave PGDM May 2001 Surge 5 16.98 N 0 0 6 4 1 3 5 2 7 Meters 5 10 25 Feet 20 15 8 Min 0 Max Waves Probability 1% / year, 100-Year Return Time Antigua 1. St. John’s Waterfront by market 1.6 m North of Rat Island 1.5 m Cruise Ship terminal 1.3 m Week Point 3.6 m 1 2. Parham Desalinization plant 1.8 m Waterfront by town 2.1 m Flood plain west of town 0.8 m 2 3. English and Falmouth Harbours Nelson’s Dockyard 1.6 m Falmouth SE 1.6 m Falmouth NW 1.7 m 4 4. Jolly Harbour Channel entrance 1.6 m Inner boat basin 1.6 m Beach front 1.7 m N 3 Directory Topo. Map
17.20 N 61.925 W 61. 65 W Ross Wagenseil for PGDM April 2001 KILOMETERS ARC-MINUTES 10 MILES 5 5 10yr 25yr 50yr 100yr SELECT Wind Wave Surge Heights PGDM May 2001 Surge 5 16.98 N 0 0 1 2 3 4 6 5 Meters 20 15 10 5 Feet Min 0 Max Surges Probability 1% / year, 100-Year Return Time Antigua 1. St. John’s Waterfront by market 1.3 m North of Rat Island 1.4 m Cruise Ship terminal 1.2 m 1 2. Parham Desalinization plant 1.5 m Waterfront by town 1.7 m Flood plain west of town 2.9 m 2 3. English and Falmouth Harbours Nelson’s Dockyard 0.6 m Falmouth SE 0.6 m Falmouth NW 0.8 m 4 4. Jolly Harbour Channel entrance 1.1 m Inner boat basin 1.2 m Beach front 1.2 m N 3 Directory Topo. Map Note: surges are reported as elevation above sea level, not depth of water.