Download
1 / 17
170 likes | 263 Views
Preliminary Results of Full-Scale Monitoring of Hurricane Wind Speeds and Wind Loads on Residential Buildings. Peter L. Datin Graduate Research Assistant. David O. Prevatt Director and Assistant Professor. Wind Load Test Facility Department of Civil Engineering Clemson University.

E N D
Preliminary Results of Full-Scale Monitoring of Hurricane Wind Speeds and Wind Loads on Residential Buildings Peter L. Datin Graduate Research Assistant David O. Prevatt Director and Assistant Professor Wind Load Test Facility Department of Civil Engineering Clemson University
Introduction The Florida Coastal Monitoring Program (FCMP) Goals of the FCMP In-field experimental methods Mobile tower system Instrumented houses Public access to collected data Wind tunnel testing Preliminary results – comparison of full-scale to wind tunnel Summary and preliminary observations Future work Outline
Hurricanes continue to cause severe damage to residential structures Historically, these tests derived from frontal weather systems Need to validate wind tunnel results for extreme wind events Wind tunnel tests can only provide limited knowledge of wind loads on full-scale structures Necessary to improve our understanding of the wind-structure interaction during extreme wind events Introduction
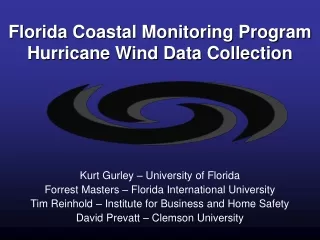
The Florida Coastal Monitoring Program was started in 1998 Research venture between Clemson University University of Florida Florida International University Institute for Business and Home Safety Sponsored by: Florida Department of Community Affairs SC and FL Sea Grant Consortia Objectives In-field measurement of hurricane wind velocities and wind-induced pressures on residential buildings Wind tunnel studies to compare with full-scale data FCMP mobilizes before a hurricane makes landfall placing instrumentation in the path of the storm
32 homes in Florida and 6 in the Carolinas are pre-wired to be instrumented Absolute pressure transducers record pressures at critical locations on the roof Establish a reference pressure to measure atmospheric pressure that must be subtracted from the absolute pressure to obtain actual wind pressures Stiff 10-meter towers placed in hurricane’s path Measure wind velocities, temperature, barometric pressure, etc. Pressure Sensors Computer Box Portable Hurricane Instrumentation
Public Access to Collected Data • High resolution wind speed data available • 10 Hz sampling rate • 15-minute mean wind speed • 3-second gust wind speed • Available in near real-time on the FCMP website • Used in official NOAA tropical cyclone reports FCMP Website www.ce.ufl.edu/~fcmp
Measured Hurricane Ivan Wind Speeds Measured wind speeds during Hurricane Ivan (2004) converted to 3-second gust at 10-meters
Atmospheric boundary layer wind tunnel Open circuit wind tunnel 3-meters wide by 2-meters high Total length – 100 feet Can simulate various terrains Model sizes from 1:50 to 1:500 Atmospheric Boundary Layer Wind Tunnel
Pressure Coefficients • Non-dimensional quantification of wind pressures • Can derive pressure coefficients from full-scale and wind tunnel • Derive pressure coefficients based on 3-sec gust wind speed • Allows direct comparison between full-scale and wind tunnel values • Allows direct comparison with building code provisions
FL-27 Measured Wind Speeds Tropical Storm Isidore (2002) Hurricane Ivan (2004)
Hurricane Ivan Peak Wind Direction Tropical Storm Isidore Peak Wind Direction FL-27 Sensor Layout and Model
-0.80 -2.72 -0.98 -2.94 -1.02 -2.80 -0.63 -0.50 -0.52 -0.57 -0.80 -2.63 -0.69 -3.29 -0.96 -3.53 -0.77 -2.62 -0.58 -0.59 -0.71 -0.71 -0.52 -0.85 -1.06 -3.53 -1.08 -1.21 -1.33 -3.38 -0.98 -2.34 -0.70 -2.52 -2.00 -2.24 -0.64 -1.15 -0.55 -0.48 -1.25 -2.75 -1.16 -1.32 -0.87 -2.83 -0.71 -3.00 -1.50 -3.43 -2.68 -3.75 -1.39 -1.10 -0.90 -0.71 -2.00 -1.46 -1.64 -1.44 -2.29 -3.88 -1.21 -2.52 N/A -2.53 -1.66 -1.39 -0.81 -0.62 -3.01 -1.09 -0.57 -0.55 -1.17 -0.83 -1.55 -3.11 -0.80 -1.32 Hurricane Ivan Peak Wind Direction Isidore FS Ivan FS ASCE 7-02 GCp,min= -2.60 Tropical Storm Isidore Peak Wind Direction Isidore WT Ivan WT Preliminary Results – Peak Minimum Cp Values
Continuing research to determine sources of error • Possible sources of error: • Inaccurate regression analysis • Wind tunnel models do not accurately simulate turbulence and wind speed for suburban terrain • Limitations of instrumentation accuracy • Adjustments to data: • 0.5Cp corresponds to 2 psf in full-scale • 20% increase in model Cp based on a different estimate of terrain roughness • By applying these changes there is close agreement between model and full-scale values -1.5 -0.5 -1.0 -3.0 -2.0 -2.5 0.25 0 -1 -0.9 -0.8 -0.7 -0.6 -0.5 -0.4 -0.3 -0.2 -0.1 0 y = 1.0542x R2 = 0.2097 y = x -1.0 y = x -2.0 Full-Scale Full-Scale -3.0 Full-Scale y = x – 1.0 -4.0 y = x -5.0 y = x – 0.5 0.00 -6.0 0 0.15 0.05 0.1 0.2 0.25 Model 1.0 Model RMS of Pressure Coefficients Model Peak Minimum Pressure Coefficients Mean Pressure Coefficient Values RMS of Pressure Coefficients 0.25 y = 1.0542x R2 = 0.2097 y = x Full-Scale 0.00 0 0.15 0.05 0.1 0.2 0.25 Model Full-Scale vs. Wind Tunnel
1 0 Cp Values -1 -2 -3 0 5 10 15 20 25 Pressure Tap Location Adjusted Results
Meteorological data used in civil engineering applications to provide greater understanding of wind characteristics and interaction with structures Unique data set on common residential building shapes subjected to hurricane force winds Linear regression shows agreement between full-scale and model scale, but this may not accurately represent the data distribution Loads measured at full-scale may not represent the worst wind loading condition since it is only from one wind direction First step in addressing continuing failures in components and cladding of residential buildings Summary and Preliminary Observations
Development of a reliability model of the data to provide a statistical basis for estimating the wind loads Further analysis of collected data from 5 additional houses in 2004 and another 5 in 2005 Distribution of wind loads through the structure Continuing importance in collecting and making meteorological data available to the research community Future research results will be posted at: davidoprevatt.com Future Work