Download
1 / 46
460 likes | 593 Views
Populations and demography. Patterns of distribution and abundance. Population fluctuations. Metamorphosing juveniles. Breeding females. Pechmann et al. 1991. Plethodon cinereus – as stable as populations get!. Population Growth. N t+1 = N t + B - D + I - E where N = population size

E N D
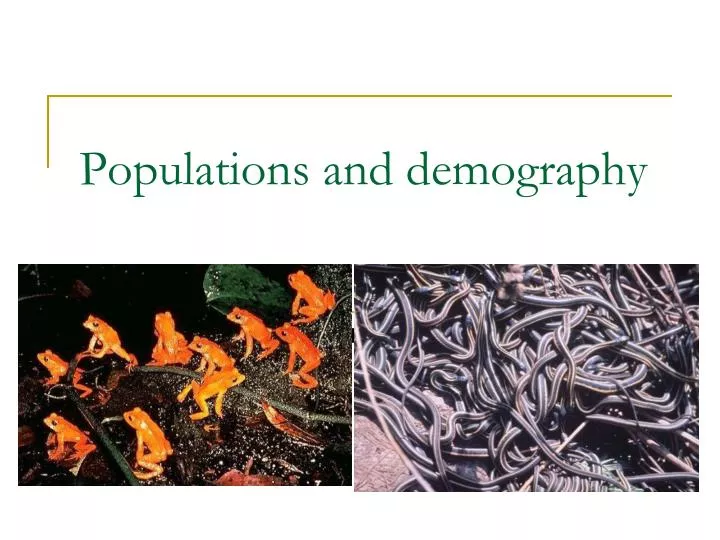
Populations and demography Patterns of distribution and abundance
Population fluctuations Metamorphosing juveniles Breeding females Pechmann et al. 1991
Population Growth N t+1 = N t + B - D + I - E where N = population size t = time B = births,D = Deaths,I = Immigrants,E = Emigrants
Within Population Processes:Survivorship versus fecundity • The best way to think of what goes on within a local population is in terms of survivorship and fecundity (i.e. deaths and births) • Survivorship must be balanced against fecundity for a population to remain stable
Among Population Processes: Migration • Connects populations • May be sufficient to make local populations dependent on one another for long-term persistence = as “metapopulations”
Three case studies: Wood frog Red-spotted newt Blanding’s turtle
Life cycle of the wood frog Larvae Metamorph Egg Adult Juvenile
How do we get these data? • Surrounded two ponds in Maryland with drift fences for 7 years! • Drift fences = aluminum window screening 0.75 m high with cans buried every 3 m on each side to catch adults and recently metamorphosed juveniles. K. A. Berven (1990), Ecology 71(4):1599-1608
K. A. Berven (1990) ~ Methods • Frogs do not regenerate clipped toes -- each frog got a pond clip on left front foot and a year clip on right front foot.
What determined survival? • 92-99% of mortality occurred before metamorphosis • Density– when greater numbers of eggs are laid, fewer tadpoles survive to reach metamorphosis. Larvae reached densities of 1,000/m2 • Hydroperiod – in years of low rainfall, aquatic densities are especially high, in wet years less crowding, more habitat! • Size at metamorphosis - Larger metamorphs were more likely to survive and to reproduce early • Rainfall - Adult survival was largely independent of age, but was correlated with rainfall
What determined fecundity? • Larger females laid more eggs than smaller females • When the adult population size was large, female clutch sizes were smaller
Sex ratios • Male and female survival did not differ • But females matured a year later than males • So about 2.3 more males as females survived to breed • These skewed sex ratios in breeding aggregations can escalate male-male competition for mates
Exam III • Last day of class…Thurs, Dec. 9 • Read Ch 8, 9, 10, and 11 from Gibbs et al. (short chapters) • Read Ch. 14 from Vitt and Caldwell • Be familiar with invited lecture (Thomas) and “Demography” and “Conservation” overview lecture by Gibbs • Know your NYS “herp regs”
Three case studies: Wood frog Red-spotted newt Blanding’s turtle
Case Study II: Red-spotted newt Co-evolution and population dynamics at the landscape scale
D. E. Gill,“The metapopulation ecology of the red-spotted newt, Notophthalmus viridescens (Rafinesque),” Ecological Monographs (1978)
Methods • Studied newts in a series of mountaintop ponds in the Shenandoah Mountains, Virginia. • Adults and juveniles captured with drift fences and dipnetting. • Individuals identified by the number and pattern of dorsal red spots • Also toe clips for pond and year of capture, identified >8,500 individuals!
Study results • Older ponds had many more individuals than newer ponds • Female survival • closely tied to population density and declined in ponds with larger populations. • Female mass • depressed in midsummer owing to severe competition for food -- little fat deposited, which predisposes them to mortality in the winter. • Foraged almost exclusively on fingernail clams.
Philopatry • Adults always homed to the same pond year after year -- with > 8,500 animals marked not one ever changed ponds between years! • Reproduction was poor, and most ponds fail to produce enough recruits to replace themselves • A very few ponds produced huge numbers of recruits. • One of the 12 ponds produced > 91% of all the young in the metapopulation one year! • Strong selection on adults to return to sites where reproduction was successful (“metapopulation centers”) • All individuals have just 1, perhaps 2, seasons to breed. Therefore, no way to ever regain the penalty of 1 lost breeding season.
Selection for dispersal • Young strongly selected to disperse as efts to the new ponds created • Ponds are temporary and females have much higher breeding success in new ponds. • Essentially a colonizing species that tracks temporary pond habitats that constantly shift in time and space.
Efts need somewhere to go: what makes the ponds that drives dispersal by newts?
Beavers ~ ecosystem engineers • Beavers create ponds with finite (10-25 year) life-spans. • Most likely newts have coevolved with beavers to track their movements and pond-creation processes. • Newts have clearly “adopted” beavers recently given that the Notophthalmus lineage is ~12 million years • This is a “landscape-scale” species
Three case studies: Wood frog Red-spotted newt Blanding’s turtle
Case Study III: Blanding’s Turtles (Emydoidea blandingii)
Congdon et al. 1993 • Demographic data on long-lived species are rare • Many species can outlive the researcher • How do life history traits constrain an organism’s ability to maintain stable populations when survival rates are reduced? • “Blanding's turtles are excellent models because they have life history characteristics similar to those of other freshwater turtles, sea turtles, and tortoises, and to those proposed for dinosaurs”
Congdon et al. 1993 ~ Methods • Conducted over 40 years (!) at the U. Michigan George’s Reserve • Turtles trapped in hoop nets in ponds and captured in drift fences. • Caught 711 individuals 2,968 times. • Marked by shell notching along margins of carapace.
Survivorship • All estimates of adult survivorship exceeded 93% and were stable from one year to the next • Generation time was 37 years • Some individuals have been marked for over 60 years.
Fecundity • Nest survivorship ranged from 0-63% • Was highly variable and averaged 44% in first half of study but only 3% in second half • Fur prices had dropped and mammal abundance had increased resulting in many more predators
Sensitivity analysis of population growth rate (r) versus survivorship and fecundity. Note that r = 0 represents a stable population
Conclusions • Population stability was most sensitive to changes in adult survival • Less sensitive to juvenile survival • Almost unresponsive to fecundity or nest survival • Turtles forgo reproduction to allocate resources to shell production • The tradeoff is late breeding but long life with continuous, though delayed reproduction
Implications • Historically there have been few threats to adults, currently there are many • Demography in this species seems to be a co-evolved set of traits that makes it difficult for populations to respond to new sources of adult mortality. • The concept of sustainable harvest for these animals is an oxymoron