
二、研究材料
二、研究材料 我們透過 Google 的強大搜尋功能,我們找到設於美國馬里蘭大學的 the Earth Science Data Interface (ESDI) at the Global Land Cover Facility 網站 (The Earth Science Data Interface, 2010; http://glcfapp.glcf.umd.edu:8080/esdi/index.jsp ) ,在該網站中可下載 1972 、 1990 、 2001 、 2006 等年份,台灣地區的 MSS 、 TM 和 ETM(+) 影像。 三、研究工具

二、研究材料
E N D
Presentation Transcript
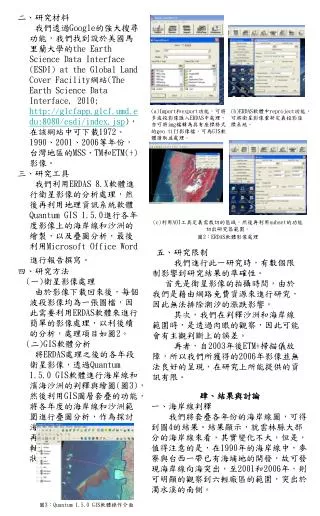
二、研究材料 我們透過Google的強大搜尋功能,我們找到設於美國馬里蘭大學的the Earth Science Data Interface (ESDI) at the Global Land Cover Facility網站(The Earth Science Data Interface, 2010; http://glcfapp.glcf.umd.edu:8080/esdi/index.jsp),在該網站中可下載1972、1990、2001、2006等年份,台灣地區的MSS、TM和ETM(+)影像。 三、研究工具 我們利用ERDAS 8.X軟體進行衛星影像的分析處理,然後再利用地理資訊系統軟體Quantum GIS 1.5.0進行各年度影像上的海岸線和沙洲的繪製,以及疊圖分析,最後利用Microsoft Office Word進行報告撰寫。 四、研究方法 (一)衛星影像處理 由於影像下載回來後,每個波段影像均為一張圖檔,因此需要利用ERDAS軟體來進行簡單的影像處理,以利後續的分析,處理項目如圖2。 (二)GIS軟體分析 將ERDAS處理之後的各年段衛星影像,透過Quantum 1.5.0 GIS軟體進行海岸線和濱海沙洲的判釋與繪圖(圖3),然後利用GIS圖層套疊的功能,將各年度的海岸線和沙洲範圍進行疊圖分析,作為探討海岸地形變遷的依據;最後再量測各年度外傘頂洲的長軸和寬軸長,與面積的變化狀況。 五、研究限制 我們進行此一研究時,有數個限制影響到研究結果的準確性。 首先是衛星影像的拍攝時間,由於我們是藉由網路免費資源來進行研究,因此無法排除潮汐的漲跌影響。 其次,我們在判釋沙洲和海岸線範圍時,是透過肉眼的觀察,因此可能會有主觀判斷上的誤差。 再者,自2003年後ETM+掃描儀故障,所以我們所獲得的2006年影像並無法良好的呈現,在研究上所能提供的資訊有限。 肆、結果與討論 一、海岸線判釋 我們將套疊各年份的海岸線圖,可得到圖4的結果。結果顯示,就雲林縣大部分的海岸線來看,其實變化不大,但是,值得注意的是,在1990年的海岸線中,麥寮與台西一帶已有海埔地的開發,故可發現海岸線向海突出,至2001和2006年,則可明顯的觀察到六輕廠區的範圍,突出於濁水溪的南側。