Download
1 / 32
320 likes | 467 Views
Chapter 4 Color in Image and Video. 4.1 Color Science. Light and Spectra • Light is an electromagnetic wave. Its color is characterized by the wavelength content of the light. (a) Laser light consists of a single wavelength: e.g., a ruby laser produces a bright, scarlet-red beam.

E N D
Chapter 4Color in Image and Video Li & Drew
4.1 Color Science • Light and Spectra • • Light is an electromagnetic wave. Its color is characterized by the wavelength content of the light. • (a) Laser light consists of a single wavelength: e.g., a ruby laser produces a bright, scarlet-red beam. • (b) Most light sources produce contributions over many wavelengths. • (c) However, humans cannot detect all light, just contributions that fall in the “visible wavelengths”. • (d) Short wavelengths produce a blue sensation, long wavelengths produce a red one. • • Spectrophotometer: device used to measure visible light, by reflecting light from a diffraction grating (a ruled surface) that spreads out the different wavelengths. Li & Drew
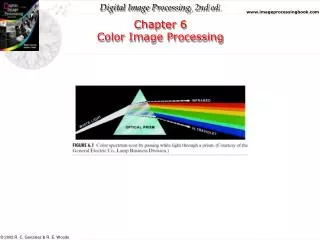
• Figure 4.1 shows the phenomenon that white light contains all the colors of a rainbow. • • Visible light is an electromagnetic wave in the range 400 nm to 700 nm (where nm stands for nanometer, 10−9 meters). Fig. 4.1: Sir Isaac Newton’s experiments. Li & Drew
• Fig. 4.2 shows the relative power in each wavelength interval for typical outdoor light on a sunny day. This type of curve is called a Spectral Power Distribution (SPD) or a spectrum. • • The symbol for wavelength is λ. This curve is called E(λ). • Fig. 4.2: Spectral power distribution of daylight. Li & Drew
Human Vision • • The eye works like a camera, with the lens focusing an image onto the retina (upside-down and left-right reversed). • • The retina consists of an array of rods and three kinds of cones. • • The rods come into play when light levels are low and produce a image in shades of gray (“all cats are gray at night!”). • • For higher light levels, the cones each produce a signal. Because of their differing pigments, the three kinds of cones are most sensitive to red (R), green (G), and blue (B) light. • • It seems likely that the brain makes use of differences R-G, G-B, and B-R, as well as combining all of R, G, and B into a high-light-level achromatic channel. Li & Drew
Spectral Sensitivity of the Eye • • The eye is most sensitive to light in the middle of the visible spectrum. • • The sensitivity of our receptors is also a function of wavelength (Fig. 4.3 below). • • The Blue receptor sensitivity is not shown to scale because it is much smaller than the curves for Red or Green — Blue is a late addition, in evolution. • – Statistically, Blue is the favorite color of humans, regardless of nationality — perhaps for this reason: Blue is a latecomer and thus is a bit surprising! • • Fig. 4.3 shows the overall sensitivity as a dashed line — this important curve is called the luminous-efficiency function. • – It is usually denoted V (λ) and is formed as the sum of the response • curves for Red, Green, and Blue. Li & Drew
• The rod sensitivity curve looks like the luminous-efficiency function V (λ) but is shifted to the red end of the spectrum. • • The achromatic channel produced by the cones is approximately proportional to 2R+G+B/20. • Fig. 4.3: R,G, and B cones, and Luminous Efficiency curve V(λ). Li & Drew
• We can succinctly write down this idea in the form of an integral: • R = ∫E(λ) qR(λ) dλ • G = ∫E(λ) qG(λ) dλ • B = ∫E(λ) qB(λ) dλ (4.2) Li & Drew
Image Formation • • Surfaces reflect different amounts of light at different wavelengths, and dark surfaces reflect less energy than light surfaces. • • Fig. 4.4 shows the surface spectral reflectance from (1) orange sneakers and (2) faded blue jeans. The reflectance function is denoted S(λ). Li & Drew
Fig. 4.4: Surface spectral reflectance functions S(λ) for objects. Li & Drew
• Image formation is thus: • – Light from the illuminant with SPD E(λ) impinges on a • surface, with surface spectral reflectance function S(λ), is • reflected, and then is filtered by the eye’s cone functions • q (λ). • – Reflection is shown in Fig. 4.5 below. • – The function C(λ) is called the color signal and consists • of the product of E(λ), the illuminant, times S(λ), the • reflectance: • C(λ) = E(λ) S(λ). Li & Drew
Fig. 4.5: Image formation model. Li & Drew
• The equations that take into account the image formation model are: • R = ∫E(λ) S(λ) qR(λ) dλ • G = ∫E(λ) S(λ) qG(λ) dλ • B = ∫E(λ) S(λ) qB(λ) dλ (4.3) Li & Drew
Camera Systems • • Camera systems are made in a similar fashion; a studio quality camera has three signals produced at each pixel location (corresponding to a retinal position). • • Analog signals are converted to digital, truncated to integers, and stored. If the precision used is 8-bit, then the maximum value for any of R,G,B is 255, and the minimum is 0. • • However, the light entering the eye of the computer user is that which is emitted by the screen—the screen is essentially a self-luminous source. Therefore we need to know the light E(λ) entering the eye. Li & Drew
Gamma Correction • • The light emitted is in fact roughly proportional to the voltage raised to a power; this power is called gamma, with symbol γ. • (a) Thus, if the file value in the red channel is R, the screen emits light proportional to Rγ, with SPD equal to that of the red phosphor paint on the screen that is the target of the red channel electron gun. The value of gamma is around 2.2. • (b) It is customary to append a prime to signals that are gamma-corrected by raising to the power (1/γ) before transmission. Thus we arrive at linear signals: • R → R′ = R1/γ ⇒ (R′)γ → R (4.4) Li & Drew
• Fig. 4.6(a) shows light output with no gamma-correction applied. We see that darker values are displayed too dark. This is also shown in Fig. 4.7(a), which displays a linear ramp from left to right. • • Fig. 4.6(b) shows the effect of pre-correcting signals by applying the power law R1/γ; it is customary to normalize voltage to the range [0,1]. Li & Drew
Fig. 4.6: (a): Effect of CRT on light emitted from screen (voltage is normalized to range 0..1). (b): Gamma correction of signal. Li & Drew
• The combined effect is shown in Fig. 4.7(b). Here, a ramp is shown in 16 steps from gray-level 0 to gray-level 255. • Fig. 4.7: (a): Display of ramp from 0 to 255, with no gamma correction. (b): Image with gamma correction applied Li & Drew
4.2 Color Models in Images • • Colors models and spaces used for stored, displayed, and printed images. • • RGB Color Model for CRT Displays • 1. We expect to be able to use 8 bits per color channel for color that is accurate enough. • 2. However, in fact we have to use about 12 bits per channel to avoid an aliasing effect in dark image areas — contour bands that result from gamma correction. • 3. For images produced from computer graphics, we store integers proportional to intensity in the frame buffer. So should have a gamma correction LUT between the frame buffer and the CRT. • 4. If gamma correction is applied to floats before quantizing to integers, before storage in the frame buffer, then in fact we can use only 8 bits per channel and still avoid contouring artifacts. Li & Drew
Subtractive color: CMY color Model • • So far, we have effectively been dealing only with additive color. Namely, when two light beams impinge on a target, their colors add; when two phosphors on a CRT screen are turned on, their colors add. • • But for ink deposited on paper, the opposite situation holds: yellow ink subtracts blue from white illumination, but reflects red and green; it appears yellow. Li & Drew
Instead of red, green, and blue primaries, we need primaries that amount to -red, -green, and -blue. I.e., we need to subtract R, or G, or B. • 2. These subtractive color primaries are Cyan (C), Magenta (M) and Yellow (Y) inks. • Fig. 4.15: RGB and CMY color cubes. Li & Drew
Transformation from RGB to CMY • • Simplest model we can invent to specify what ink density to lay down on paper, to make a certain desired RGB color: • (4.24) • Then the inverse transform is: • (4.25) Li & Drew
• Fig. 4.16: color combinations that result from combining primary colors available in the two situations, additive color and subtractive color. • Fig. 4.16: Additive and subtractive color. (a): RGB is used to specify additive color. (b): CMY is used to specify subtractive color Li & Drew
4.3 Color Models in Video • • Video Color Transforms • (a) Largely derive from older analog methods of coding color for TV. Luminance is separated from color information. • (b) For example, a matrix transform method similar to Eq. (4.9) called YIQ is used to transmit TV signals in North America and Japan. • (c) This coding also makes its way into VHS video tape coding in these countries since video tape technologies also use YIQ. • (d) In Europe, video tape uses the PAL or SECAM codings, which are based on TV that uses a matrix transform called YUV. • (e) Finally, digital video mostly uses a matrix transform called YCbCr that is closely related to YUV Li & Drew
YUV Color Model • (a) YUV codes a luminance signal (for gamma-corrected signals) equal to Y ′ in Eq. (4.20). the “luma”. • (b) Chrominance refers to the difference between a color and a reference white at the same luminance. → use color differences U, V: • U = B′ − Y′ , V = R′ − Y′ (4.27) • From Eq. (4.20), • (4.28) • (c) For gray, R′ = G′ = B′, the luminance Y′ equals to that gray, since 0.299+0.587+0.114 = 1.0. And for a gray (“black and white”) image, the chrominance (U, V ) is zero. Li & Drew
(d) In the actual implementation U and V are rescaled to have a more convenient maximum and minimum. • (e) For dealing with composite video, it turns out to be convenient to contain the composite signal magnitude within the range −1/3 to +4/3. So U and V are rescaled: • U = 0.492111 (B′ − Y′) • V = 0.877283 (R′ − Y′) (4.29) • The chrominance signal = the composite signal C: • C = U·cos(ωt) + V ·sin(ωt) (4.30) • (f) Zero is not the minimum value for U, V . U is approximately from blue (U > 0) to yellow (U < 0) in the RGB cube; V is approximately from red (V > 0) to cyan (V < 0). • (g) Fig. 4.18 shows the decomposition of a color image into its Y′, U, V components. Since both U and V go negative, in fact the images displayed are shifted and rescaled. Li & Drew
Fig. 4.18: Y ′UV decomposition of color image. Top image (a) is original color image; (b) is Y ′; (c,d) are (U, V) Li & Drew
YIQ Color Model • • YIQ is used in NTSC color TV broadcasting. Again, gray pixels generate zero (I, Q) chrominance signal. • (a) I and Q are a rotated version of U and V . • (b) Y ′ in YIQ is the same as in YUV; U and V are rotated by 33°: I = 0.492111(R′ − Y ′) cos 33° − 0.877283(B′ − Y ′) sin 33° Q = 0.492111(R′ −Y ′) sin 33°+0.877283(B′ −Y ′) cos 33° (4.31) • (c) This leads to the following matrix transform: • (4.32) • (d) Fig. 4.19 shows the decomposition of the same color image as above, into YIQ components. Li & Drew
YCbCr Color Model • • The Rec. 601 standard for digital video uses another color space, YCbCr, often simply written YCbCr — closely related to the YUV transform. • (a) YUV is changed by scaling such that Cb is U, but with a coefficient of 0.5 multiplying B′. In some software systems, Cb and Cr are also shifted such that values are between 0 and 1. • (b) This makes the equations as follows: • Cb = ((B′ − Y′)/1.772)+0.5 • Cr = ((R′ − Y′)/1.402)+0.5 (4.33) • (c) Written out: • (4.34) Li & Drew
(d) In practice, however, Recommendation 601 specifies 8-bit coding, with a maximum Y′ value of only 219, and a minimum of +16. Cb and Cr have a range of ±112 and offset of +128. If R′, G′, B′ are floats in [0.. + 1], then we obtain Y ′, Cb, Cr in [0..255] via the transform: • (4.35) • (f) The YCbCr transform is used in JPEG image compression and MPEG video compression. Li & Drew
YCbCr Y′ is the luma component and CB and CR are the blue-difference and red-difference chroma components Li & Drew