Download
1 / 20
210 likes | 235 Views
Learn how to sketch polynomial functions, rational graphs, and cubic functions with key features such as multiplicity, end behavior, and asymptotes. Practice sketching various graphs and analyze their characteristics.

E N D
Plotting graphs How could the graph of y = x3 – 7x + 2 for the interval –3 ≤ x ≤ 3 be plotted? By creating a table of points, plotting them and joining them with a smooth curve. These values of x and y correspond to the coordinates of points that lie on the curve.
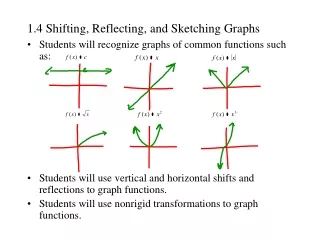
Sketching polynomial functions When the general shape of a graph is known it is more usual to sketch the graph using key features. • The x- and y-intercepts.Substitute y = 0 or x = 0 into the equation. • Find the multiplicity of the x-intercepts.A zero with an even multiplicity means that the graph is tangent to the x-axis at that point, a zero with an odd multiplicity is where the graph crosses the x-axis. • Determine the end behavior.The trend of y-values as x approaches positive or negative infinity. Look at the coefficient, a, and degree, n, of the polynomial to determine the end behavior.
The graph of y = 1/x Describe the key features of the graph of y = 1/x . The curve gets closer and closer to the x- and y-axes but never touches them. 1 = y x The x- and y-axes form the vertical and horizontal asymptotes. The graph of y = 1/x is an example of a discontinuous function. Describe what discontinuous means.
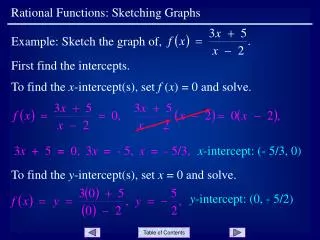
Sketching rational graphs A rational function can be sketched by finding the key characteristics: 1. Use the standard form to find the horizontal asymptotes, which indicates the end behavior of the graph. 2. Use the factored form to find the vertical asymptotes. 3. Find any holes. 4. Find the x- and y-intercepts. 5. Perform a sign test on either side of each vertical asymptote to determine the direction of the graph.
Sketching rational functions (1) x2 x2 – 25 Sketch a graph for the rational function f(x) = . 1. find the horizontal asymptotes: The degree of the numerator and denominator is the same, so the asymptote is the ratio of their coefficients. Horizontal asymptote at y = 1. 2. factor to find the vertical asymptotes: x2 (x + 5)(x – 5) f(x) = Vertical asymptotes at x = –5 andx = 5. 3. find any holes: There are no holes.
Sketching rational functions (2) x2 x2 – 25 Sketch a graph for the rational function f(x) = . 4. find the x-intercepts: find the y-intercepts: f(0) = (0)2/(0 + 5)(0 – 5) y = 0 0 = x2/(x + 5)(x – 5) x = 0 5. perform a sign test on either side of x = 5 and x = –5: + + lim f(x) = = + ∞ x–5– + – lim f(x) = = – ∞ x–5+ + – lim f(x) = = – ∞ x5– + – lim f(x) = = + ∞ x5+
Slant asymptotes If the degree of the numerator is greater than the degree of the denominator by exactly one, the graph has a slant asymptote. It is found using division. 3x2 – 2x + 1 x + 5 Find the asymptote of f(x) = . use synthetic division: 3 –5 –2 1 –15 85 3 86 –17 86 x + 5 this gives: f(x) = 3x – 17 + y = 3x – 17 is a slant asymptote. If the degree of the numerator is more than one greater than the denominator, there are no horizontal or slant asymptotes.
Sketching a graph using its features Sketch a rational function with the following features: • vertical asymptotes at x = 4 and x = 0 • horizontal asymptote at y = 0 • passes through the point (2, –1/4). • as x → 0+,f(x) → –∞ and as x → 0–,f(x) → ∞. • as x → 4–,f(x) → –∞ and as x → 4+,f(x) → ∞. Sketch in the asymptotes and given point. Mark the end behavior using arrows. Sketch the graph. What is the equation of this graph? 1 x2 – 4x f(x) =