PM2.5 Implementation Rule- Modeling Summary
PM2.5 Implementation Rule- Modeling Summary. Brian Timin EPA/OAQPS Timin.brian@epa.gov June 20, 2007. Attainment Demonstrations. CAA Section 172(c) requires States with a nonattainment area to submit an attainment demonstration

PM2.5 Implementation Rule- Modeling Summary
E N D
Presentation Transcript
PM2.5 Implementation Rule- Modeling Summary Brian Timin EPA/OAQPS Timin.brian@epa.gov June 20, 2007
Attainment Demonstrations • CAA Section 172(c) requires States with a nonattainment area to submit an attainment demonstration • All States must submit attainment demonstrations which include modeling (§51.1007) • Emissions inventories (base and future years) • Adopted control measures
Air Quality Modeling • “National or regional” modeling • EPA or other regional modeling which uses national or regional databases without specific local improvements to emissions, meteorology, land use, etc. • “Local” modeling • State or regional organization modeling which uses detailed local data to make improvements in model inputs • Most States are performing “local” photochemical modeling for their PM2.5 nonattainment areas • In some cases the modeling will be supplemented with local dispersion modeling for primary PM2.5
Regional and National Modeling • The PM2.5 rule says that States can use “regional or national” modeling as part of their demonstration • However, the State/RPO modeling is generally more consistent with modeling guidance • Therefore, in most cases, EPA modeling should only be used as supplemental information (weight of evidence) • EPA has not produced any modeling for 2010 (or 2009) since the CAIR rule • All recent EPA modeling is for 2015 and 2020
Ozone/PM2.5/Regional Haze Modeling Guidance • “Guidance on the use of Models and Other Analyses for Demonstrating Attainment of Air Quality Goals for Ozone, PM2.5, and Regional Haze” http://www.epa.gov/scram001/guidance/guide/final-03-pm-rh-guidance.pdf • Original draft- January 2001 • Draft final- September 2006 • Final version- April 2007 • Final ozone guidance has been incorporated into the final PM2.5 and RH guidance (single, slimmed down, 253 page document)
What’s in the Guidance? • Part I- Using Model Results • Modeled Attainment tests • 8-hour ozone NAAQS • Unmonitored area analysis • Annual and 24-hour PM2.5 NAAQS • Unmonitored area analysis • Local area analysis (high primary PM2.5 areas) • Regional Haze reasonable progress • Supplemental analyses/weight of evidence • Activities to support Mid-Course review and future modeling • Required documentation
What’s in the Guidance? • Part II- Generating Model Results • Conceptual description • Modeling protocol • Selecting a model(s) • Choosing days/episodes • Selecting domain & spatial resolution • Developing met inputs • Developing emissions inputs • Evaluating model performance/diagnostic analyses
Choosing an Air Quality Model • There is no “preferred model” • Models should meet Appendix W requirements for “alternative models” • “Alternative Models” should be: • Peer reviewed • Demonstrated to be applicable to the problem being addressed • Adequate data bases should be available to run the model • Model should be shown to have performed adequately in the past • Source code must be available at no cost (or for reasonable cost) • Vast majority of States/RPOs will use CMAQ or CAMx for ozone, PM2.5, and regional haze • Use of AERMOD for local primary PM2.5 issues (local area analysis) • This modeling guidance does not address: • Dispersion modeling of PM2.5 for NSR/PSD • Transportation conformity hot-spot analyses
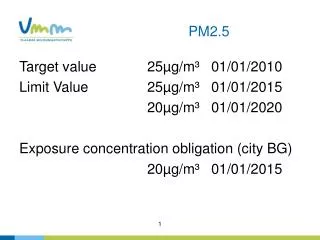
Recommendations for “Episode” Selection • Recommendations are essentially unchanged from original drafts • Annual PM2.5 NAAQS • Model full year or >= 15 days per quarter • 24 Hour NAAQS • Model days > 65 ug/m3* or “high end of distribution” • Model days in each quarter (as appropriate) • Regional Haze • Model a full year (or more) or at least 10 worst (and best) visibility days at each Class 1 area *We expect the attainment test for the new 24-hr PM2.5 standard to be the same or similar to the procedures in the current version of the modeling guidance. As part of the implementation process for the revised standard, the procedures in the guidance will be re-evaluated.
Horizontal Resolution • Recommendations are essentially unchanged from original drafts • <= 12 km resolution for PM2.5 attainment demonstration modeling • Higher resolution may be necessary in areas with high primary PM2.5 concentration gradients • Recommend <= 36 km resolution for regional haze modeling
Weight of Evidence/Supplemental Analyses • All attainment demonstrations should include “supplemental” analyses to corroborate the modeling results • Three main categories of supplemental analyses • Modeling • Trends • Diagnostic analyses • Weight of evidence applies when future design values are “close to” NAAQS (either above or below)
Weight of Evidence • Recommended WOE range: • Annual PM2.5 14.5-15.5 ug/m3 • 24-hour PM2.5 62-67 ug/m3 • 8 hour Ozone 82-87 ppb • If concentration is >WOE range: “More qualitative results are less likely to support a conclusion differing from the outcome of the modeled attainment test”
Base Year Design Value Calculation • 5 year weighted average design value (ozone, annual, and 24-hour NAAQS) • More stable “anchor point” than a single design value period • Same methodology used for CAIR and PM NAAQS rule • Consideration should be given to the impact of “extreme” meteorology and/or large emissions changes (during the 5 year period)
Base Modeling Year • Guidance recommends 2002 as the base emissions year • Recommendation based on EPA memo establishing 2002 as a base year for inventory submittals • Other, more recent years can be used
Future Modeling Year(s) • Future modeling years depend on attainment dates and details contained in the O3 and PM2.5 implementation rules • RACT/RACM • Most areas will model 2009 for ozone and PM2.5 • Other future years (2012, 2014, and beyond) may be needed depending on classifications, bump-ups and/or attainment date extensions
Modeled Attainment Tests • All O3/PM2.5/RH modeled attainment tests use model estimates in a “relative” sense • Premise: models are better at predicting relative changes in concentrations than absolute concentrations • Relative Response Factors (RRF) are calculated by taking the ratio of the model’s future to current predictions of PM2.5 or ozone • RRFs are calculated for ozone and for each component of PM2.5 and regional haze
Speciated Modeled Attainment Test (SMAT) for PM2.5 • The attainment test for PM2.5 uses separate RRFs for each PM2.5 species • SMAT test is essentially the same as implemented in CAIR (and PM NAAQS rule) • Recommend interpolating species concentrations to FRM sites (when necessary) • Species concentrations are interpolated to get species fractions at FRM sites • FRM values are not interpolated • Guidance recommends species adjustments based on Frank’s (2006) SANDWICH technique
Speciated PM2.5 Mass Components as defined in SMAT • PM2.5FRM = { [OCMmb] + [EC] + [SO4] + [NO3FRM] + [NH4FRM] + [water] + [crustal material] + [0.5] } • OCMmb- organic carbon mass by difference • EC- measured elemental carbon • SO4- measured sulfate ion • NO3FRM- nitrate retained on the FRM filter • NH4FRM- ammonium retained on the FRM filter • Water- particle bound water mass attached to sulfate, nitrate, and ammonium • Other primary particulate- soil and other inorganic mass • Blank mass- a constant 0.5 ug/m3 blank mass
Model Attainment Test Software (MATS) • Software has been developed to project future year design values • Performs ozone, PM2.5, and regional haze tests (as outlined in the modeling guidance) • MATS for PM2.5 not available yet • Interpolates ambient data (where necessary) for ozone and PM2.5 tests • Creates “gradient adjusted” spatial fields for unmonitored area analysis
MATS • Provides a consistent set of ambient data for all States to use • Ozone and PM2.5 design values • Pre-screened daily average STN and IMPROVE data for PM2.5 attainment test • Official IMPROVE visibility data for 2000-2004 base period
Status of MATS • Released version with ozone and regional haze analyses in June http://www.epa.gov/scram001/modelingapps_mats.htm • PM2.5 tests still undergoing QA
Unmonitored Area Analysis (UAA) • The attainment test is a monitor based test • Future year design values should also be examined in unmonitored areas • Unmonitored Area Analysis (UAA) is recommended • Uses interpolated ambient design values and model output • Interpolated spatial fields (design values) are adjusted up or down based on modeled concentration gradients • Similar tests for ozone and PM2.5 • UAA not designed to look for unmonitored PM micro-scale hot-spot issues • 12 km resolution should be sufficient • UAA is a supplemental analysis • If a problem area is identified, guidance recommends implementing emissions controls or placing new monitor(s) in the area
Local Area Analysis (LAA) • Analysis to improve the accuracy of modeled emissions changes of local primary PM2.5 • Local primary PM2.5 gradients cannot be accurately modeled with a relatively coarse grid model • LAA provides a more accurate assessment of the change in air quality at monitors, due to changes in local primary emissions • Local area analysis can use either dispersion model or fine grid Eulerian model (1km?)
Local Area Analysis • Analysis is applied by quarter • For dispersion modeling analysis: • Identify local sources • Quantify local source contribution at monitor • Run dispersion model • Use relative change in concentration to adjust future year annual or 24-hour design values
Summary • All nonattainment areas must submit an attainment demonstration which includes future year modeling • Future years to model and the relationship between modeling and RACT/RACM is governed by the requirements in the PM2.5 implementation rule • Details provided in RACT/RACM presentations • The PM2.5 modeling guidance is final • Details of the attainment tests, unmonitored area analysis, local area analysis, etc. can be found in the guidance • MATS tool is available for ozone and regional haze • Version with PM2.5 will be available soon