Download
1 / 42
420 likes | 574 Views
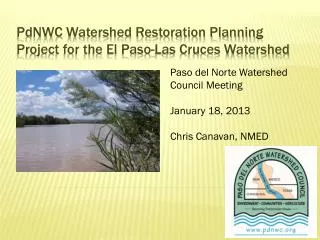
Paso del Norte W atershed Council Meeting January 18, 2013 Chris Canavan, NMED. PdNWC Watershed Restoration Planning Project for the El Paso-Las Cruces Watershed. S tate of New Mexico issued a TMDL for E. coli bacteria in 2007. PdNWC received 319(h) grants in 2006 and 2010.

E N D
Paso del Norte Watershed Council Meeting January 18, 2013 Chris Canavan, NMED PdNWC Watershed Restoration Planning Project for the El Paso-Las Cruces Watershed
State of New Mexico issued a TMDL for E. coli bacteria in 2007. PdNWC received 319(h) grants in 2006 and 2010. Preliminary watershed plan produced in 2008. The preliminary plan recommended a water quality sampling program and increased stakeholder outreach. Monthly sampling effort initiated in 2008 to present. Working group stakeholder meetings held. Project Timeline / Activities
Enters the environment via feces of warm blooded animals. Most strains of E. coli are not harmful to humans. E. coli is used as an indicator of fecal contamination. Potential diseases: typhoid, hepatitis A, dysentery, and cholera. E. coli 0157 is toxic (spinach, lettuce, salsa incidents). WQ Standard in New Mexico for E. coli is- 126 coliform-forming units/mL (goemetric mean). 410 cfu/mL (single sample). E.Coli bacteria as a pollutant WHY SHOULD WE BE CONCERNED?
a. Identification of causes and sources b. Estimate of needed load reductions c. Description of management measures d. Estimate of technical and financial assistance e. Information / education component f. Schedule for implementation g. Description of measureable milestones h. Criteria developed to determine if load reductions are achieved i. Monitoring component to evaluate effectiveness Nine Elements of the Watershed Plan CWA Section 319 Grant Guidelines: http://www.epa.gov/owow_keep/NPS/cwact.html
Where are the greatest sources of the pollutant located? When does the pollutant occur? Can activities be identified related to the pollution? Useful tools to answer these questions can include: Literature review, developing a sampling and monitoring program, and modeling. Element a Identification of causes and sources
The Elephant Butte Irrigation District began a monitoring program in 2008 that consists of sampling the main stem of the Rio Grande, agricultural drains return flows, and stormwater sampling. This effort is still ongoing.
Monitoring Program Goals Monitor the main stem for exceedances. Identify trends: spatial, temporal, flow conditions, stormwater. In 2010, a goal was added to identify “hotspots” to be selected for further analysis (microbial source tracking).
Primarily focused on sampling stormwater runoff above Leasburg during the monsoon season. Revealed E. coli concentrations ranging from 400 cfu/100mL to 560,000 cfu/100mL. Although these high concentrations led to elevated levels in the river they were not as high as those observed in the tributaries. Haynor Bridge sample was 900 cfu/100mL on 7/9/2008. Leasburg Cable sample was 700/cfu 100mL on 7/10/2008. 2008 E. coli Monitoring
Routine mainstem sampling began in October. Samples were collected on October 2, 29, 30, and December 22 (three sampling events). All samples were below the criteria of 410 cfu/100mL in a single sample. E. coli concentrations ranged from <1 cfu/100mL (Caballo Dam) to 210 cfu/100mL (Sunland Park). 2008 E. coli Monitoring
The limited sampling indicated that stormwater runoff could play a significant role in increasing E. coli concentrations above the 410 cfu/100mL standard. Only the Mesquite drain was sampled. This sampling occurred on October 10 at four locations and revealed elevated levels and ranged from 200 cfu/100mL to 1200 cfu/100mL. No clear patterns or trends could be determined from the 2008 sampling effort. 2008 E. coli Monitoring
Samples were collected monthly at 7 river sites: Caballo Dam Cable, Haynor Bridge, Leasburg Cable, Picacho Bridge, Mesilla Dam, Anthony 225 Bridge, and Sunland Park Bridge. Quarterly sampling of 8 drains began in March: Hatch drain, Rincon drain, Del Rio drain, La Mesa drain, East drain, Anthony drain, NewMexas drain, and West drain. Opportunistic stormwater sampling was also conducted. 2009 E. coli Monitoring
One sample from Haynor Bridge exceeded 410 cfu/100mL with 630 cfu/100mL on 7/29/09 (storm related). Three samples from Anthony exceeded the single sample criterion: 710 cfu/100mL on 5/29/09, 510 cfu/100mL on 6/30/09, and 430 cfu/100mL on 8/27/09(non-storm related). All other stations remained below 410 cfu/100 mL although the Caballo Dam Cable site had one 400 cfu/100mL (12/21/09), and Anthony had one 400 cfu/100mL (9/30/09). 2009 E. coli Monitoring
Stormwater sampling in May and September continued to show elevated levels of E. coli entering the system during thunderstorm runoff events. High E. coli concentrations entering the Rio Grande from Broad Canyon in May decreased rapidly in just a few miles. Drain sampling revealed extremely high E. coli concentrations in June and September, especially in the southern drains. These elevated levels do not appear to be associated with stormwater runoff. 2009 E. coli Monitoring
Samples were collected monthly at 7 river sites: Caballo Dam Cable, Haynor Bridge, Leasburg Cable, Picacho Bridge, Mesilla Dam, Anthony 225 Bridge, and Sunland Park Bridge. Quarterly drain sampling was discontinued. Previously unsampled drains were sampled: Garfield, Seldon, Picacho, and Montoya, drains. More intense sampling occurred in East drain and Mesquite drain. Opportunistic stormwater sampling continued. 2010 E. coli Monitoring
Two storm events occurred which led to elevated E. coli levels. A storm on July 12 resulted in elevated E. coli levels upstream of Las Cruces reaching as high as 24,000 cfu/100mL at Leasburg. A storm on July 26 resulted in elevated E. coli levels throughout the system ranging from 800 cfu/100mL at Mesilla Dam to 2,300 cfu 100/mL at Leasburg. Anthony had the only non-storm related exceedance at 470 cfu/100mL in March. 2010 E. coli Monitoring
Flow and E. coli sampling results for the Rio Grande below Caballo Lake @ cableway.
Flow and E. coli sampling results for the Rio Grande at Hayner Bridge.
Flow and results of E. coli sampling at the Rio Grande below Leasburg Dam.
Flow and results of E. coli sampling at the Rio Grande above Picacho Bridge.
Flow and results of E. coli sampling at the Rio Grande below Mesilla dam.
Flow and results of E. coli sampling at the Rio Grande at Anthony Bridge.
Flow and results of E. coli sampling at the Rio Grande at Sunland Park.
The northern drains continued to have E. coli concentrations below the standard. The southern drains continued to show elevated concentrations of E. coli unrelated to stormwater runoff. Mesquite drain and East drain appear to be problem areas. East drain typically had E. coli concentrations higher than the other drains. 2010 E. coli Monitoring
From January 2009-December 2010 only 8% of the samples exceeded the 410 cfu/100mL criterion forE. coli (14 out of 166 samples). Out of those 14 samples 9 were directly related to stormwater runoff events. Anthony Bridge sampling revealed a pattern of elevated E. coli concentrations unrelated to stormwater runoff. Some drains contain high concentrations of E. coli. Preliminary Conclusions.
A microbial source tracking study began in the fall of 2010 to determine the source host organism at select sites. Source tracking samples were collected at the Anthony Bridge site and East drain. Two additional source tracking sites were chosen. They were located at Leasburg cable and Sunland Park below the WWTP outfall. Microbial Source Tracking.
Triplicate samples were collected. Samples were analyzed with the m-Coliblue 24 method. Filters were held for up to 5 days then shipped to lab. E. coli DNA is then extracted using Pulsed Field Gel Electrophoresis. Results are then compared with genetic library reference DNA. Sampling and Processing for Source Tracking
A concurrent study was focused on E. coli above and below the Sunland Park WWTP. NMED began collecting E. coli samples in April 2011 in the River and at all permitted discharges from Elephant Butte Dam downstream. An additional station was added for this effort at Corchesne. Sampling continued through March 2012. Additional Sampling Efforts.
Impairment from E. coli is highly associated with stormwater runoff over much of the watershed. The exception occurs at the bottom of the reach in the vicinity of Anthony and Sunland Park. The project demonstrated that drains at the bottom of the watershed are a contributing factor to the E. coli problem. A portion of this may also have been related to the Vado and Sunland Park WWTP. Conclusions
Addressing Stormwater- Retention structures Upland and in-drainage restoration Utilizing existing agricultural infrastructure LID/Green Infrastructure Outreach Potential Management Practices
Addressing Chronic (non-stormwater) areas Upgrading WWTP including collection systems Assessing manure management practices Assessing potential illegal discharges Outreach Potential Management Practices
Data Analysis is complete. Partial draft of the watershed plan has been prepared. Some of the plan elements remain incomplete. Working draft to be ready February 2013 Reviewed by stakeholders spring 2013. Finaldraft completed by June 2013. Current Efforts.
Questions/Comments Discussion