Effective Traffic Control Devices and Intersection Management
650 likes | 715 Views
Learn about the capacity and delay management at signalized intersections, types of control, definitions, signal timing methods, and operational analysis procedures according to the MUTCD guidelines.

Effective Traffic Control Devices and Intersection Management
E N D
Presentation Transcript
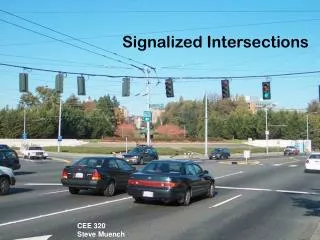
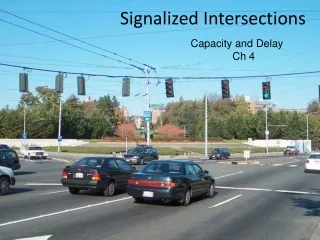
Capacity and Delay Ch 4 Signalized Intersections
Manual on Uniform Traffic Control(MUTCD) To be effective, a traffic-control device must: • Fulfill a need • Command attention • Convey a clear, simple meaning • Command the respect of road users • Give adequate time for proper response
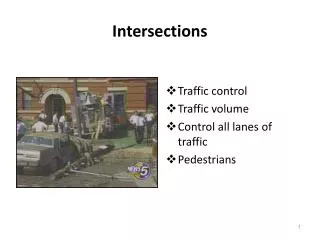
Types of intersection Control -Yield Signs -Stop Signs -All way Stop Signs -Intersection Channelization -Traffic Signals -Interchange (Grade separated)
Signal warrants • Warrant 1, Eight-hour vehicular volume • Warrant 2, Four-hour vehicular volume • Warrant 3, Peak hour • Warrant 4, Pedestrian volume • Warrant 5, School crossing • Warrant 6, Coordinated signal system • Warrant 7, Crash experience • Warrant 8, Roadway network
Definitions Controller A device in a traffic signal installation that changes the colors indicated by the signal lamps according to a fixed or variable plan. Cycle (cycle length) The time in seconds required for one complete color sequence of signal indication. Phase (signal phase) That part of a cycle allocated to a stream of traffic or a combination of two or more streams of traffic having the right-of-way simultaneously during one or more intervals.
Definitions Saturation Flow Rate (s) Maximum flow that could pass through an intersection if 100% green time was allocated to that movement. S (vehicles/hour) = 3600/headway (seconds per vehicle) Approach Capacity (c) Saturation flow times the proportion of effective green c = s × g/C Offset The time lapse in seconds or the percentage of the cycle length between the beginning of a green phase at an intersection and the beginning of a corresponding green phase at the next intersection. It is the time base of the system controller.
Definitions Flow Ratio (q/s) The ratio of actual flow rate (q) to saturation flow rate (s) for a lane group at an intersection Lane Group A set of lanes established at an intersection approach for separate analysis Critical Lane Group The lane group that has the highest flow ratio (q/s) for a given signal phase ( requires the longest green time in a phase). Critical Volume-to-Capacity Ratio (Xc) The proportion of available intersection capacity used by vehicles in critical lane groups In terms of v/c and NOT q/s
Definitions Change and clearance interval The total length of time in seconds of the yellow and all-red signal indications. This time is provided for vehicles to clear the intersection after the green interval before conflicting movements are released. All-red interval The display time of a red indication for all approaches. It issometimes used as a phase exclusively for pedestrian crossing or to allow vehicles and pedestrians to clear very large intersections before opposing approaches aregiven the green indication.
Definitions Effective Green Time (Ge) Time effectively utilized for movement Ge= G + y + AR – tL Effective Red Time (r) Time during which a movement is effectively not permitted to move. r = R + tL r = C – Ge
Definitions Peak-hour factor (PHF). A measure of the variability of demand during the peak hour.
Fig. Typical Lane Groups for Analysis -Separate lane groups should be established for exclusive left-turn lane(s).
Saturation flow Ideal saturation flow (so)=1900 veh/h of green time per lane.
Signal Timing at Isolated Intersections Yellow Interval: is to alert motorists that the green light is about to change to red and to allow vehicles already in the intersection to cross it.
Types of Control 1. Fixed (Pretimed) Signals Fixed cycle length, Several timing options possible, need traffic history. 2. Semiactuated, 3. Fully actuated.
Pretimed Signals advantages and disadvantages: Advantages: Simple Can be coordinated Easy to field adjust Can handle peak and off peak condition Disadvantages: Cannot react to short term demand changes Can cause excessive delay Sometimes results in disrespect.
Semiactuated signal: Detectors on minor approaches. Fully actuated signal: Varying traffic demand Detectors on all approaches Maximum and minimum green times are set for each approach.
Cycle Lengths of Fixed (Pretimed) SignalsWebster Method: q or v
Allocation of Green Times. C : actual cycle length used (usually obtained by rounding off Co to the nearest five seconds). Gte (or gte) : total effective green time per cycle.
Solution equivalent hourly flows = peak-hour volumes /PHF.
The Highway Capacity Method: The capacity of an approach or lane group is:
The ratio of flow to capacity (v/c) is usually referred to as the degree of saturation :
Movements Protected movement: A movement that has the right-of-way and does not need to yield to conflicting movements, such as opposing vehicle traffic or pedestrians. Permitted movement: A movement that must yield to opposing traffic flow or conflicting pedestrian movements.
Operational Analysis Procedure When long delays occur at (v/c) ratios less than 1, it may be due to a combination of two or more of the following conditions. • Long cycle lengths • Green time is not properly distributed, resulting in a longer red time for one or more lane groups. • A poor signal progression, (large percentage of the vehicles on the approach arriving during the red phase). It is also possible to have short delays at an approach when the (v/c) ratio equals 1. • Short cycle length • Favorable signal progression, resulting in a high percentage of vehicles arriving during the green phase
Clearly, LOS F does not necessarily indicate that the intersection, approach, or lane group is oversaturated, nor can it automatically be assumed that the demand flow is below capacity for a LOS range of A to E.
Baseline Assumptions - D/D/1 queuing - Approach arrivals < departure capacity (no queue exists at the beginning/end of a cycle)
D/D/1 Signal Analysis (Graphical) Departure Rate Arrival Rate Vehicles Queue dissipation Total vehicle delay per cycle (Dt) Maximum delay Maximum queue Time Green Green Red Red Green Red
D/D/1 Signal Analysis – Numerical Time to queue dissipation after the start of effective green Maximum number of vehicles in a queue