Download
1 / 51
510 likes | 616 Views
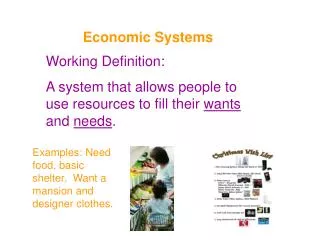
This overview explores essential economic goals, including economic growth aimed at increasing GDP and enhancing the standard of living. It emphasizes the importance of economic efficiency in maximizing output from limited resources and sustaining price level stability to protect consumers' purchasing power. The text also addresses the equitable distribution of income, advocating for a society where wealth disparity is minimized. Additionally, it highlights the significance of economic freedom and security, ensuring individuals can choose employment and that provisions exist for those unable to care for themselves.

E N D
6 Economic Goals 1. Economic Growth [Increase in GDP or per capita GDP] 3% annual growth will increase our standard of living. 1929-Per capita=$792; 1933-Per capita=$430; 2009-per capita= $48,000 2.Economic Efficiency – “obtaining the maximum output from available resources” or “maximum benefits at minimum cost from our limited resources.” “Doing the best with what we have.”
. 6 Economic Goals 3.Price Level Stability – sizable inflation or deflation should be avoided. A person making $25,000 a year at age 30 would need (with average inflation of 5%) $125,000 a year at age 65 to have the same standard of living. 1972 --------82; 1982-------2009 In 1982, it took $2.31 to buywhat $1 bought in 1972. In 2009, it took $2.23 to buy what $1 bought in 1982. Today, it takes $11 to buy what $1 bought in 1945.
6 Economic Goals 4.An Equitable Distribution of Income. One group shouldn’t have extreme luxury while another is in stark poverty. The richest 1%(3 mil.) have as much total income after taxes [average $400,000 a year as the bottom 40% [100 million people]. The richest 1% have greater wealth than the bottom 90% of the population. Have not’s Haves
5. Economic Freedom • You are free to: • Choose your job • Choose where and when you work • Work for yourself or someone else • Leave your job and to move to another job • Businesses are free to: • Choose which workers they want • Figure out how much business they want to do
. 6. Economic Security – provision should be made for those not able to take care of themselves – handicapped, disabled, old age, chronically ill, orphans. Protection from lay-offs [unemployment insurance]. Also no discrimination. 43 million Americans have some type of disability. A. Hearing impaired: 22 million (including 2 million deaf) B. Totally blind: 120,000 (Legally blind: 60,000) C. Epileptic: 2 million D. Paralyzed: 1.2 million E. Developmentally disabled; 9.2 million F. Speech impaired: 2.1 million G. Mentally retarded: up to 2.5 million H. HIV infected: 900,000
What questions should countries ask before they decide on what kind of economy they will have? • What goods and services should be produced? • Think about resources? Where to allocate those resources? • What needs a country has? What wants a country has • How should these goods and services be produced? • Think factor of production and how many does a country have in each area • Who consumes these goods and services? • Think about different countries values and goals? • Type of government?
Survival Island Project You have 20 minutes (click to start timing)
Scarcity Unlimited Wants Limited Resources Choices WHO will receive the G/S produced? WHAT G/S to produce? HOWwill the G/S be produced? Most needy or most money 3 BASIC ECONOMIC QUESTIONS Answers to the above determine: ECONOMIC SYSTEMS [Eskimo/pygmy] TRADITIONAL COMMAND FREE MARKET
1. Traditional Economy Strengths • Everyone knows their role. • Little uncertainty over what to produce or how to produce. • The question of For Whom to produce is answered by custom. • Life is generally stable, predictable, and continuous. • Economic activity is based on ritual, habit and custom. Weaknesses • Tends to discourage new ideas. • Lack of progress leads to lower standard of living.
2. Command Economy • Government“rules”. • Economic decisions are made at the top and the people are expected to go along with choices their leaders make. Strengths • Change direction drastically in a relatively short time (The USSR went from an agrarian to industrial nation in a very short time). Weaknesses Fidel Castro • Not designed to meet the wants and needs of individuals. • Lack of incentives to work hard leads to unexpected results. • Large bureaucracy for economic planning. • Not flexible in dealing with minor day to day problems. • People with new or unique ideas are stifled. Karl Marx
3. Market Economy • Markets allow buyers and sellers to come together in order to exchange goods and services. • People and firms act in their own best interest to answer economic questions. Strengths • Markets can adjust over time. • Freedom exists for everyone involved. • Relatively small degree of governmental influence. • Decision making is decentralized. • Variety of goods and services are produced. • High degree of consumer satisfaction. Adam Smith “Invisible” hand
Weaknesses Of A Market Economy • The primary weakness is deciding for whom to produce. • The young, sick, old, and lazy would have difficulty in a pure market environment. • Markets sometimes fail. • Competition (monopolies may develop) • Resource mobility (resources are sometimes hindered from moving about) • Availability of information (producers often have more information than do consumers, which gives them an advantage)
1. Hong Kong 3. Australia 6. Canada 9. United States 20. Japan 33. Uruguay 91. Zambia 135. China 143. Russia 175. Venezuela 177. Cuba 179. North Korea Index of Economic Freedom [Ranking of 179 countries for 2010] FREE MOSTLYFREE MOSTLYUNFREE REPRESSED http://www.heritage.org/index/Ranking
Competition and the Invisible hand Smith is saying that participants in the economy are motivated by self-interest& that the“invisible hand”of the marketplace guidesthis self-interest into promoting general economic well-being. The Case for the Market System Adam Smith said the “invisible hand”determines what gets produced, how, & for whom.
Specialization The Wealth of Nations 1776 Laissez Faire Economics (No government intervention) Self Interest Adam Smith Scotland 1723-1790 The Invisible Hand Father of Economics [Adam Smith]
The Circular Flow The Circular Flow is an abstract, oversimplified model, showing how economic transactions [resources, products (g/s), and money] take place. Products [goods/services] 1 2 a. Goods and services b. Consumer expenditures c.Land, labor, cap., entrepreneur d. Rent, wages, interest, & profits 1 2 Householders Businesses 4 3 3 Resources [Land, labor, cap., ent.] 4
Hog CIRCULAR FLOW MODEL RESOURCE MARKET 1 2 Mechanic • Products [Goods/services] • Consumer expenditures • Land, Labor, Capital, Entrepreneur • Rent, Wages, Interest Profits 4 HOUSEHOLDS BUSINESSES 3 3 PRODUCT MARKET 4
Hog CIRCULAR FLOW MODEL RESOURCE MARKET 1 2 Mechanic • Products [Goods/services] • Consumer expenditures • Land, Labor, Capital, Entrepreneur • Rent, Wages, Interest Profits 4 HOUSEHOLDS BUSINESSES 3 1 2 3 4 PRODUCT MARKET
The Circular-Flow Diagram Product Market 1 2 What flow are the following? A. Consumer expenditures? B. Goods and services? C. Land, labor, capital, and entrepreneurs? D. Rent, wages, interest, and profits? 2 1 4 3 Businesses Households Labor 3 4 Resource Market
The Circular-Flow Diagram Resource Market Labor 1 2 • What flow are the following? • A. Goods/services? • B. Consumer expenditures? • C. Land, labor, capital and • entrepreneurial ability? • Rent, wages, interest, • and profits? 4 3 1 2 Households Businesses Outhouse 3 4 Product Market
Practice Fuzzy Wuzzy Circular Flow 1. In the product market (householders/businesses) are the demanders and (householders/businesses) are the suppliers. 2. In the resource market (householders/businesses) are the demandersand (householders/businesses) are the suppliers. 3. In the resource market, (householders/businesses) sell resources to (householders/businesses). 4. In the product market, (householders/businesses) sell products [goods/services] to (householders/businesses).
The “GangstaCar” Circular Flow Product Market Chrysler300 “Gangsta Car 1 2 Which flow represents? A. Consumer expenditures? B. Goods and services? C. Land, labor, capital, and entrepreneurial ability? D. Rent, wages, interest, and profits? 2 1 4 ChryslerPlant Businesses 3 Households Laborfor “Gangsta Cars” 3 4 Resource Market
The Circular-Flow Diagram Resource Market Labor 1 2 Which Flow Represents? A. Goods/services? B. Consumer expenditures? C. Land, labor, capital and entrepreneurial ability? D. Rent, wages, interest, and profits? 4 3 1 2 Households Businesses Fuzzy Wuzzy 3 4 Product Market