Download
1 / 49
550 likes | 617 Views
Explore the Biome-BGC model tracking Carbon, Water, Nitrogen, and Energy Fluxes in ecosystems. Learn about its key processes, carbon and nitrogen pools, photosynthesis factors, and energy balance principles. Delve into modeling of vegetation, soil components, growth, respiration, and more.

E N D
Introduction to Biome-BGC Ryan Anderson* September 23, 2009 *With thanks to Jordan Golinkoff, Faith Ann Heinsch, Matt Jolly, and anybody else whose slides or work made it into this document
“All models are wrong, but some are useful”-G.E. Box • Models are an abstraction of reality • Goal is to represent the relevant processes in sufficient detail to answer research or management questions • Simplifying assumptions need to be made • Making a model more detailed or complicated does not necessarily make it better
Biome-BGC • Biome = A major regional or global community, characterized chiefly by the dominant forms of vegetation and the prevailing climate • BGC = BioGeoChemical • Bio = living organisms (plant responses) • Geo = Earth (soils) • Chemical = chemical reactions, specifically carbon, nitrogen, and water Biome-BGC is a process-based model that tracks Carbon, Water, Nitrogen, and Energy Fluxes through terrestrial ecosystems.
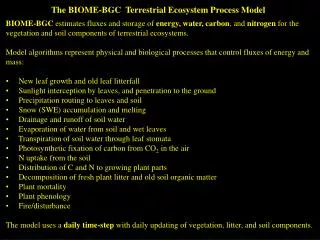
The BIOME-BGC Terrestrial Ecosystem Process Model • BIOME-BGC estimates fluxes and storage of energy, water, carbon, and nitrogen for the vegetation and soil components of terrestrial ecosystems. • Model algorithms represent physical and biological processes that control fluxes of energy and mass: • New leaf growth and old leaf litterfall • Sunlight interception by leaves, and penetration to the ground • Precipitation routing to leaves and soil • Snow (SWE) accumulation and melting • Drainage and runoff of soil water • Evaporation of water from soil and wet leaves • Transpiration of soil water through leaf stomata • Photosynthetic fixation of carbon from CO2 in the air • N uptake from the soil • Distribution of C and N to growing plant parts • Decomposition of fresh plant litter and old soil organic matter • Plant mortality • Plant phenology • Fire/disturbance • The model uses a daily time-step with daily updating of vegetation, litter, and soil components.
The BIOME-BGC Terrestrial Ecosystem Process Model • Not an individual Species Model • Most Biological Process represented at the Canopy Level (i.e. a ‘Big Leaf’ or ‘Green Sponge’ Model) • Daily Time Step • No Defined Spatial Scale (pools and fluxes are represented on a per unit area basis) • Not a Spatial Model (no linkages between gridcells) • Prognostic Model
BIOME-BGC General Concepts • Growth (Uptake CO2 for photosynthesis) • F(temp,humidity,radiation,soil water deficits) • Farquhar photosynthesis equation • Differentiated by sunlit and shaded leaves • Reduced by environmental constraints • Allocation • Once photosynthesis takes place, the model must allocate fixed carbon to different places (I.e. roots, leaves, stems, etc…,) • Respiration • Both for maintaining current biomass and growing new biomass. Net loss of CO2 to the atmosphere.
Digging Deeper: How does Biome BGC represent important biological and physical processes? • Pools and Fluxes • Photosynthesis • Stomatal Conductance • Radiation interception and transmission • Transpiration and Evaporation • Links to Photosynthesis – Stomatal Conductance, energy balance • Routing of Precipitation • Growth and Maintenance Respiration • Decomposition – Heterotrophic Resipration • Carbon Allocation • Nutrient Availability
Photosynthesis 6 CO2 + 6H20 C6H12O6 + 6O2 Rubisco catalyzes both the carboxylation and oxygenation of RuBP!
Michaelis-Menten Enzyme Kinetics Reaction rate depends on the maximum reaction rate , the concentration of the substrate (CO2), and the MM constant (Km). Rubisco reacts with both CO2 and oxygen, so it has an MM constant for each. CO2 concentration MM constant, adjusted for effect of competition with oxygen
Factors controlling VcMax (lnc) x (flnr) x (fnr) x (act) = (Vcmax) Rubisco activity = f(Tleaf) Determined from protein structure (constant 7.16 gR/gN – Rubisco is approximately 14% nitrogen by mass) Fraction of leaf N in Rubisco Area-based leaf N concentration = 1/ (SLA C:Nleaf)
Regeneration of RUBP can also limit photosynthesis • Light is required to produce ATP required to regenerate RUBP • Plants have evolved such that light harvesting capacity is closely linked to maximum carboxylation rates (Jmax = 2.1 * Vmax, Wullschleger 1993) • Realized Rate(J) of RUBP regeneration is related to light intensity(ppfd) according to a quadratic function: 0.7J2 – (Jmax + (ppfd/2))J + Jmax(ppfd/2) = 0
Regeneration of RUBP can also limit photosynthesis Apply some stoichiometry and we get the radiation (RUBP) limited rate of photosynthesis: This equation is based on the energy requirements of the Calvin Cycle and the relationship between rubisco carboxylation and oxygenation as expressed through the CO2 compensation point. Don’t worry about the details.
CO2 must diffuse through stomates in order for photosynthesis to take place Tradeoff-CO2 gain leads to water loss feedback between carbon and water cycles
Stomatal aperture is controlled by many variables • Cold temperatures • Hot temperatures • Low soil water availability • Supply • High atmospheric demand for water • –Demand • Changes in the gradient of CO2 • Any of these will reduce photosynthesis • –Weather drives ecological processes Modeling plant ecosystem processes requires that we treat the most important components
Photosynthesis in Biome-BGC A= g * (Ca – Ci) Stomatal Conductance limit Carboxylation Limit Substrate Regeneration limit Variables impacting photosynthetic rate: -CO2 concentration (and an assumed oxygen concentration) -Temperature -Stomatal Conductance -Solar Radiation -Leaf Nitrogen -Leaf Respiration rate (which, as we will see, is a function of leaf nitrogen and temperature)
Differing light environments of leaves are important for modeling canopy scale photosynthesis Vertical Gradient of Leaf Traits with Canopy Depth High light = high leaf N, thick, short lived leaves with large maintenance respiration costs Low Light = Lower leaf N, thinner, longer lived leaves with lower respiration costs
Two Layer Canopy in Biome-BGC • User specifies a ratio of sunlit to shaded leaves • User specifies a ratio of sunlit SLA to shaded SLA • Biome-BGC calculates leaf area for each based on total leaf C • Stomatal Conductance, Transpiration, and VcMax are calculated • Seperately for each layer • Photosynthesis Routine is run separately for each layer
Penman-Monteith Equation provides Basis for ET estimates sA+ρCp(esat – e)/ra λE= s+γ(1+rs/ra) λ = latent heat of evaporation (J/kg – a function of temperature) ρ = air density (kg/m3 _ function of temperature) s = slope of the saturated VP vs. Temp curve (at right) γ = A constant (Pa/K) A = Net Radiation (W/m2) Cp = Specific Heat of Air (J/Kg/K) e = Vapor Pressure Esat = Saturated Vapor Pressure Ra = aerodynamic resistance (s/m) Rs = surface resistance (s/m) Evaporation is driven by: 1) available Energy 2) Vapor Pressure Deficit 3) Resistance terms
(MPa) (%) Soil Class Silt loam Silt Loam β-value -4.625 -3.84 -5.275 VWC_sat 0.48 0.48 0.41 PSI_sat -0.0073 -0.0078 -0.0013 BIOME-BGC 1Soil Water – Soil Water Potential Curves 1after Cosby et al., 1984
Autotrophic Respiration • Maintenance Respiration: • Empirical relationship with tissue nitrogen • Computed separately for each live tissue pool • Scaled to temperature using a Q10 formula Q10 represents the change in respiration rate that occurs with a 10 degree change in temperature • MR = 0.218 kg C / kg N day * N * 2.0(T – 20)/10
Autotrophic Respiration • Growth Respiration: • 30% of all carbon allocated to new tissue is respired.
Decomposition Cellulose Labile Lignin
Carbon Allocation • User specified, constant allometric ratios: • Percent of storage • New fine root : new leaf • New stem : new leaf • New live wood : new total wood • New coarse root : new stem • Each compartment has a C:N ratio • Used to calculate Nitrogen demand of potential new growth • If soil mineral nitrogen is insufficient, the day’s production is reduced • Allocation ratios are difficult to parameterize from the literature, but have important impacts on production, respiration rates, and pool sizes
Summary - Carbon • Photosynthesis • Rates are determined by leaf nitrogen • Needs water from the soil • Reduced by water supply/demand, carbon supply/demand • Respiration • Loss of carbon from the system • Maintenance and growth • Autotrophic • Heterotrophic
Summary - Water • Transpiration • Water lost by stomata which also control CO2 uptake • Canopy interception of precipitation • Determined by the amount of carbon fixed by photosynthesis that is allocated to leaf • Soil water evaporation • Driven by the weather • Outflow Determined by excess water not taken up by the plant
Summary - Nitrogen • Nitrogen in the leaves • Determine maximum photosynthetic rate • Atmospheric N deposition (pollution) • Additional inputs to the system • Soil N limitations • Plants compete with soil microbes for nitrogen to incorporate into plant tissue
Running Biome-BGC – what is required? • Site Physical Description (part of ini file) • Vegetation Ecophysiological Parameters (epc file) • Meteorology (met file) • Model run instructions (part of ini file)
Meteorological Parameters Required by Biome-BGC • Daily maximum temperature (°C) • Daily minimum temperature (°C) • Daylight average temperature (°C) • Daily total precipitation (cm) • Daylight average partial pressure of water vapor (Pa) • Daylight average shortwave radiant flux density (W/m2) • Daylength (s)
Example Met. Data Input(Generated from MT-CLIM) Missoula, 1950-1993 : Sample input for MTCLIM v4.1 MTCLIM v4.1 OUTPUT FILE : Tue Aug 25 10:15:00 1998 year ydayTmaxTminTdayprcp VPD sraddaylen (deg C) (deg C) (deg C) (cm) (Pa) (W m-2) (s) 1950 1 -3.90 -13.90 -6.65 0.10 158.19 123.31 30229 1950 2 -7.80 -21.70 -11.62 0.00 136.27 183.78 30284 1950 3 -16.10 -23.30 -18.08 0.00 53.36 140.67 30344 1950 4 -11.70 -20.60 -14.15 0.10 83.07 119.72 30408 1950 5 -13.90 -25.00 -16.95 0.00 78.17 177.64 30476 1950 6 0.60 -14.40 -3.53 0.10 264.00 142.03 30549 1950 7 4.40 -4.40 1.98 0.00 297.13 158.19 30626 1950 8 -2.20 -11.70 -4.81 0.10 182.84 126.15 30707 1950 9 -2.20 -12.20 -4.95 0.00 193.26 173.66 30793
Biome-BGC Initialization file Biome-BGC v4.1.2 example : (normal simulation, Missoula, evergreen needleleaf) MET_INPUT (keyword) start of meteorology file control block metdata/miss5093.mtc41 meteorology input filename 4 (int) header lines in met file RESTART (keyword) start of restart control block 0 (flag) 1 = read restart file 0 = don't read restart file 0 (flag) 1 = write restart file 0 = don't write restart file 1 (flag) 1 = use restart metyear 0 = reset metyear restart/enf_test1.endpoint input restart filename restart/enf_test1.endpoint output restart filename TIME_DEFINE (keyword - do not remove) 44 (int) number of meteorological data years 44 (int) number of simulation years 1950 (int) first simulation year 0 (flag) 1 = spinup simulation 0 = normal simulation 6000 (int) maximum number of spinup years (if spinup simulation) CLIM_CHANGE (keyword - do not remove) 0.0 (deg C) offset for Tmax 0.0 (deg C) offset for Tmin 1.0 (DIM) multiplier for Prcp 1.0 (DIM) multiplier for VPD 1.0 (DIM) multiplier for shortwave radiation
Biome-BGC Initialization file, continued CO2_CONTROL (keyword - do not remove) 0 (flag) 0=constant 1=vary with file 2=constant, file for Ndep 294.842 (ppm) constant atmospheric CO2 concentration xxxxxxxxxxx (file) annual variable CO2 filename SITE (keyword) start of site physical constants block 1.0 (m) effective soil depth (corrected for rock fraction) 30.0 (%) sand percentage by volume in rock-free soil 50.0 (%) silt percentage by volume in rock-free soil 20.0 (%) clay percentage by volume in rock-free soil 977.0 (m) site elevation 46.8 (degrees) site latitude (- for S.Hem.) 0.2 (DIM) site shortwave albedo 0.0001 (kgN/m2/yr) wet+dry atmospheric deposition of N 0.0004 (kgN/m2/yr) symbiotic+asymbiotic fixation of N RAMP_NDEP (keyword - do not remove) 0 (flag) do a ramped N-deposition run? 0o, 1=yes 2099 (int) reference year for industrial N deposition 0.0001 (kgN/m2/yr) industrial N deposition value EPC_FILE (keyword - do not remove) epc/enf.epc (file) evergreen needleleaf forest ecophysiological constants
Biome-BGC Initialization file, continued W_STATE (keyword) start of water state variable initialization block 0.0 (kg/m2) water stored in snowpack 0.5 (DIM) initial soil water as a proportion of saturation C_STATE (keyword) start of carbon state variable initialization block 0.001 (kgC/m2) first-year maximum leaf carbon 0.0 (kgC/m2) first-year maximum stem carbon 0.0 (kgC/m2) coarse woody debris carbon 0.0 (kgC/m2) litter carbon, labile pool 0.0 (kgC/m2) litter carbon, unshielded cellulose pool 0.0 (kgC/m2) litter carbon, shielded cellulose pool 0.0 (kgC/m2) litter carbon, lignin pool 0.0 (kgC/m2) soil carbon, fast microbial recycling pool 0.0 (kgC/m2) soil carbon, medium microbial recycling pool 0.0 (kgC/m2) soil carbon, slow microbial recycling pool 0.0 (kgC/m2) soil carbon, recalcitrant SOM (slowest) N_STATE (keyword) start of nitrogen state variable initialization block 0.0 (kgN/m2) litter nitrogen, labile pool 0.0 (kgN/m2) soil nitrogen, mineral pool
Biome-BGC Initialization file, continued • OUTPUT_CONTROL (keyword - do not remove) • outputs/oth (text) prefix for output files • 1 (flag) 1 = write daily output 0 = no daily output • 1 (flag) 1 = monthly avg of daily variables 0 = no monthly avg • 1 (flag) 1 = annual avg of daily variables 0 = no annual avg • 1 (flag) 1 = write annual output 0 = no annual output • 1 (flag) for on-screen progress indicator • DAILY_OUTPUT (keyword) • 9 (int) number of daily variables to output • 623 13 summary.daily_gpp • 624 14 summary.daily_mr • 625 15 summary.daily_gr • 626 16 summary.daily_hr • 627 17 summary.daily_fire • 636 18 summary.vegc • 637 19 summary.litrc • 638 20 summary.soilc • 21 summary.totalc • ANNUAL_OUTPUT (keyword) • 2 (int) number of annual output variables • 545 0 annual maximum projected LAI • 1 vegetation C • END_INIT (keyword) indicates the end of the initialization file
Verification of BIOME-BGC Daily and Seasonal Dynamics: Comparisons with Tower Eddy-flux Measurements Mature Aspen Stand (SSA-OA BERMS site) Mature Black Spruce Stand (NSA-OBS Ameriflux site) ET ET NEP NEP Kimball et al., 1997a,b