
Uploaded by
kovit
6 SLIDES
189 VIEWS
60LIKES
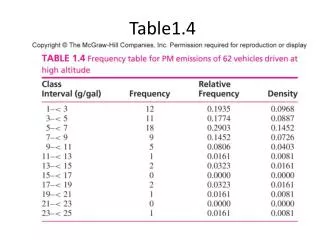
Understanding Right and Left Skewed Histograms with Box Plot Examples
DESCRIPTION
This document explores the characteristics of right and left skewed histograms and illustrates their relevance in data analysis. It includes examples of relative frequency histograms and box plots to help visualize the skewness in different datasets. By examining these graphical representations, you will gain insight into data distribution, central tendency, variability, and the presence of outliers, thereby enhancing your analytical skills.
Download
1 / 6
Download Presentation 
Understanding Right and Left Skewed Histograms with Box Plot Examples
An Image/Link below is provided (as is) to download presentation
Download Policy: Content on the Website is provided to you AS IS for your information and personal use and may not be sold / licensed / shared on other websites without getting consent from its author.
Content is provided to you AS IS for your information and personal use only.
Download presentation by click this link.
While downloading, if for some reason you are not able to download a presentation, the publisher may have deleted the file from their server.
During download, if you can't get a presentation, the file might be deleted by the publisher.
E N D
Presentation Transcript
More Related
Audio
Live Player